Profit from changes in the market structure when prices reverse and retract.
Market structure reversal alert indicators can recognise when a price or trend movement is approaching exhaustion and is ready to reverse. It alerts you to changes in market structure that typically occur when a reversal or major pullback is imminent.
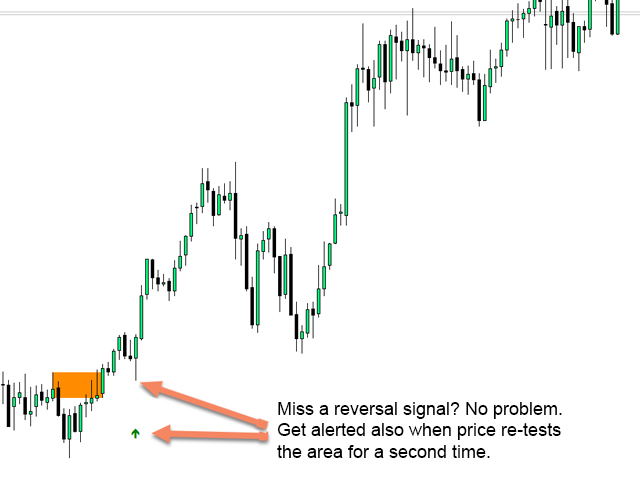
The indicator helps identify breakouts and price impulses when the new low or high occurs near an exhaustion point. The indicator draws a rectangle over the candle that was the opposite colour. It then follows the rectangle and the price as it moves within its current short-term trend. If the price is so weak that it can close above or below the rectangle, this could be an indication of a shift in market structure. The indicator warns you of a possible change in direction as well as the start of a possible trend reversal or major setback.

Features
- Alerts you to possible changes in the structure of markets at the key exhaustion points.
- Automatically draws short-term market structure when prices approach exhaustion levels
- The alert rectangles are trailed behind the price as it shifts in its current direction to identify the most tight entries
- Changes color to a solid rectangle in alerts to indicate any potential reversals of market structure have occurred.
- Works with any symbol and timeframe.
- Pop-up with push and email notifications are integrated into
- Alerts when a retest of a reversal alert occurred, confirming the alert as more likely
- It allows you to see the reversal rectangles of higher time frames on the lower time frame. Ideal for trend traders, and helps to identify higher-frequency trend direction
- Select all reversal alerts or only short or long alerts. Select the directional alerts you’d like to receive in accordance with each pair’s current trend direction.
- Look at the higher time frame’s the directional bias arrow in the chart of your lower time frame.
Strategy & guide to trading with the Market Structure Reversal Indicator
When a reversal alert is recognised:
Turn left! Are there support/resistance or supply/demand levels that we are heading towards. Changes in the structure of the markets (reversals) usually occur when price attempts to retest an old level or when a stop-hunt has occurred above or below that resistance or support level.
Check another time frame to determine which area of support or resistance we are looking at. As we said before, changes in market structure can occur on lower time frames, but the market is strongest at higher levels on a longer time frame.
If you meet the above criteria, simply place a trade towards the opposite side.
It is possible to add more indicators for validation or use this indicator to confirm your current indicators or strategy!
Stop Loss and Take Profit
The stop you set should always be just above the highest point or below the last low. In the event that the market reversal has been successful and a shift in market structure has been identified, the price will not reverse its position above or below the recent high. How much you stop depends on the intensity of the previous move that led to the recent high.
The take profit is at the discretion of the trader, but a ratio of 1.5:1 or a risk: reward ratio of 2:1 is achievable. If you enter two trades and use a trail with prices just below or above the new rectangles when they appear on the charts, you could achieve a ratio of 5:1 and a better risk/reward ratio.
