

A single pair only tells you how two currencies are doing against each other, which can be misleading — EURUSD can be flat simply because both currencies are weak (or both strong) together. This indicator solves that by looking at every currency pair the broker offers among the 8 majors (USD, EUR, GBP, JPY, CHF, AUD, CAD, NZD), measuring each pair's percentage change over a lookback window, and averaging each currency's contribution across all the pairs it appears in. The result is a genuine relative-strength score per currency, not just a two-way comparison.
Because the base currency of a pair gains exactly what the quote currency loses, the math stays simple and self-consistent: every pair contributes +change to its base currency's score and -change to its quote currency's score, and each currency's final score is just the average of everything it took part in. Pairs the broker doesn't offer (some exotic crosses aren't available everywhere) are automatically skipped, so the ranking degrades gracefully instead of failing outright.
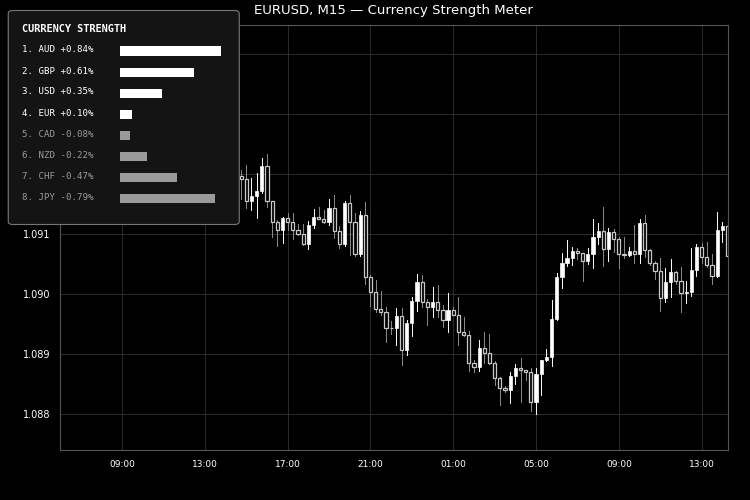
Because the base currency of a pair gains exactly what the quote currency loses, the math stays simple and self-consistent: every pair contributes +change to its base currency's score and -change to its quote currency's score, and each currency's final score is just the average of everything it took part in. Pairs the broker doesn't offer (some exotic crosses aren't available everywhere) are automatically skipped, so the ranking degrades gracefully instead of failing outright.
How to interpret it
- The ranked list — all 8 currencies, sorted strongest to weakest, refreshed every time the panel updates. The strongest currency is always row 1.
- The percentage value — each currency's average percentage change across all its available pairs over the chosen lookback window; positive means strengthening, negative means weakening.
- Bar length — scaled relative to whichever currency has the largest absolute score that refresh, so the strongest and weakest currencies are visually obvious even when the numeric differences are small.
- Bar/text color — InpStrongColor for a positive (strengthening) score, InpWeakColor for a negative (weakening) score.
- Refresh timing — with InpUpdateOnNewBarOnly enabled (default), the panel recalculates once per new bar of the chart it's attached to; disable it to recalculate on every tick instead.
Attachments
Last edited: