Description
Finding the right one is key. True RSI That price bounces off at a level you can easily manage. This could be 60 instead of 70. This could be 40 instead of 30. That’s the True RSI Market. This is how it looks. Below is a screenshot showing how our True RSI Indicator works. It identifies key levels at which price bounces.
The image shows that the TFA True RSI indicator has scanned 5 major swing lows, which bounced very nicely. We can adjust the sensitivity or how strict these swing lows are. So in the past 5 times price bounced nicely – it coincided with RSI being at 32-36% 4 out of 5 times (4 orange boxes show how nicely it bounced, 1 red box to show that it didn’t bounce).
What does this mean? This means there is a 80% chance of a price rise when RSI reaches 32-36%. This strategy alone gives us an advantage over the market for trading and making money. yes!). If you want to increase your trading profits, you can add basic support and resistance or Fibonacci.
We have narrowed down these five values over years of testing:
- 13
- 21
- 34
- 55
- 89
We have made it possible to test up to five RSI values at once in our indicator. This will enable the TFA True RSI indicator to scan multiple RSI periods for bounces and the table will tell you if any True RSI levels are hidden on the chart.
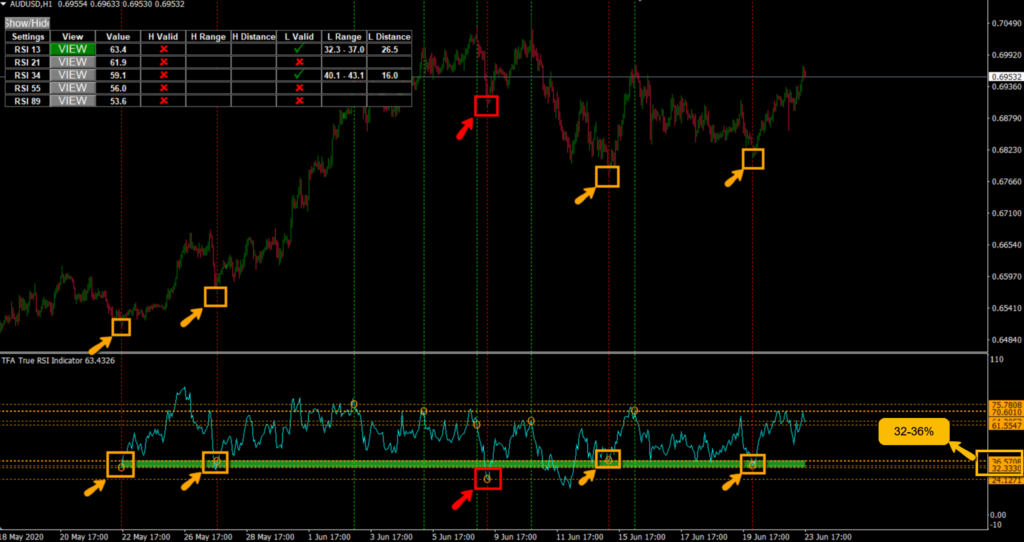
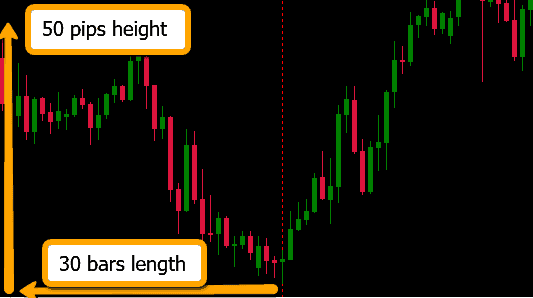
The above image shows us scanning through 5 RSI settings (13-21,34,5589), and our True RSI indicator will tell us which area contains valid hidden RSI levels.
Below is a description of the settings.
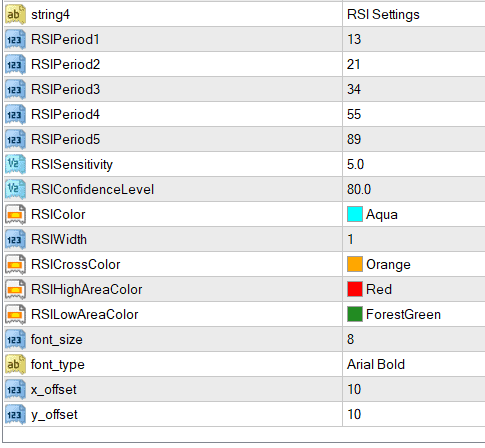
- Settings:
These are the RSI settings that we are currently testing (up to five at a given time).
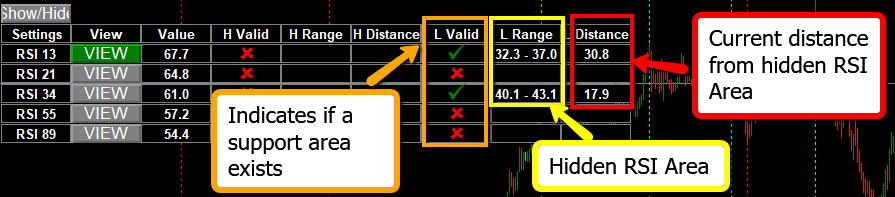
 - View:
Clicking on this will open the hidden area as well as the RSI. When there is a hidden RSI area, we usually click “View”. - H is valid:
High Valid means there is a hidden RSI Swing high resistance area (when we are playing drops instead than bounces). - H Range
This hidden RSI range shows the hidden RSI swing high resistance. - H Distance
This shows the distance between the current RSI and the hidden area. The closer it is, the lower the number. - L valid:
Low Valid means there is a hidden RSI Swing Low Support Area (from which we play bounces). - L Range:
It shows the hidden RSI range that contains the hidden RSI swing high support. - Distance L
This shows the distance between the current RSI and the hidden area. The closer it is, the lower it will be.
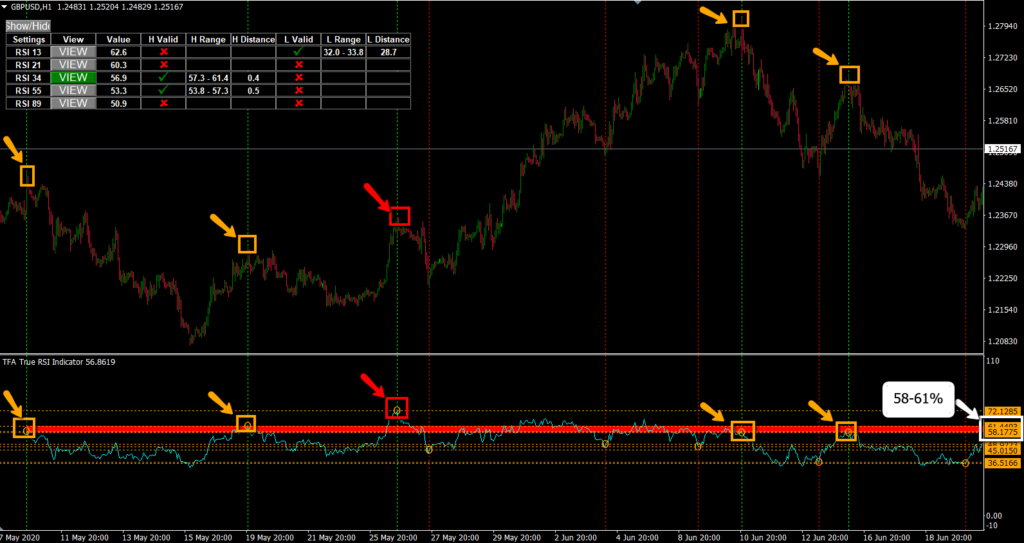
“You also mean that this works in finding overbought regions?”
> Yes, that’s right. Let me show it to you:
As you can see from the photo. We used the same 80% confidence level with a 5×5 sample and discovered a hidden RSI resistance range of 58-61%. This is quite different to the 70% that most people believe. The valid reversals are indicated by the orange arrows + boxes. The red arrow + box indicates the 1/5th time it didn’t reverse correctly. We still have a 80% confidence level, since we have 4 orange (valid) and one red (invalid).
You can improve any trading strategy by using this method to identify high probability reversal levels.
What else is there to know about this indicator, then?
You can adjust the sensitivity of many items because it is flexible. Below is a screenshot showing the settings and its explanations.
Here’s a description of the settings:
- ATR Period, Swing Sensitivity, ATR MultiplierThese three go hand in hand to decide how large your swing low or swing highs are on a price chart. These are essential if we want to create beautiful swing lows or swing highs.Here’s an example:
ATR Period = 14. (assuming that the current ATR value of 10 pips is true)
ATR Multipler = 5 (so 10 x 5 = 50 pips)
Swing Sensitivity =30 bars
This means that the indicator will require a swing high/low within 30 bars of at least 50 pip.
- Swing Number
This is how many swing highs/lows will you consider. It is best not to have too many, as it can become quite chaotic. Five is my preferred number. We’ll be looking for the 5 most significant swing highs and 5 most significant swing lows.
- RSI Period (1.2,3.4,5)
These are the RSI settings that you want to test. Personally, I prefer the 13, 21, 34, 55 and 89 numbers. - RSI Sensitivity
This is the “hidden zone’s sensitivity”. This indicates that the scanner scans within a 5-foot radius (e.g. 10% to 15% The smaller the number, the more precise the area must be. It shouldn’t be too small, but 5% seems to be the ideal size. 10% will be able to find large areas, which would make it less useful. - RSI Confidence Level
Remember that “SwingNumber”, which I mentioned earlier? This is the percentage of swing highs/lows which must fall within our hidden area (as determined by RSI Sensitivity). Given that our swing number is 5, and our RSI confidence level is 80% (assuming our RSI sensitivity of 5%), that means that 80% need to be within a 5% zone. This means that 4 of the 5 most recent swing highs/lows must be within a 5% area (assuming RSI Sensitivity is 5%).
Reviews
There are no reviews yet.