

Reverse RSI Bands is an advanced custom indicator that reverse-engineers the Relative Strength Index (RSI) formula. It plots the exact price levels directly on your main chart, showing you precisely at what price the RSI will hit your specified overbought or oversold levels. This transforms the RSI from a lagging oscillator into a predictive price action tool.
Unlike the traditional RSI, which is usually shown in a separate sub-window, this indicator displays the exact price thresholds on the chart. Traders can anticipate market extremes, set precise limit orders, and identify dynamic support or resistance zones before the oscillator reaches its actual target.
This version uses precise algebraic deductions of the recursive Wilder Smoothing formula. It guarantees that the price levels match the standard MetaTrader 5 RSI exactly, calculating the required price for the current bar using the verified state of the previous bar to avoid repainting.
Input Parameters:
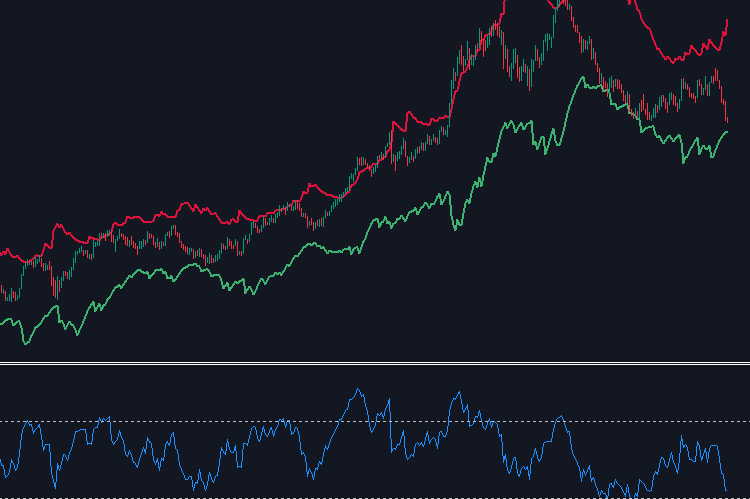
Unlike the traditional RSI, which is usually shown in a separate sub-window, this indicator displays the exact price thresholds on the chart. Traders can anticipate market extremes, set precise limit orders, and identify dynamic support or resistance zones before the oscillator reaches its actual target.
This version uses precise algebraic deductions of the recursive Wilder Smoothing formula. It guarantees that the price levels match the standard MetaTrader 5 RSI exactly, calculating the required price for the current bar using the verified state of the previous bar to avoid repainting.
Input Parameters:
- RSI Period: The lookback period for the RSI calculation (Default: 14).
- Overbought target RSI: The RSI level that defines the upper price band (Default: 70.0).
- Oversold target RSI: The RSI level that defines the lower price band (Default: 30.0).
- Applied Price: The price type used for calculations (Default: Close Price).