

- Highlights of the Asian Session, London open and New York open (Kill Zones)
- Highlights New York midnight open time (12am)
- Highlights New York 8:30am News time
- Highlights New York Stock Exchange (NYSE) 9:00 am open
- Automatically adjusts to your time zone.
- Make use of New York time for all indication time entries.
- Local Time Converter
- Shows your current (computer) time on each candle (via the candle hover window)
- Shows New York time on every candle (via the candle hover window)
Kill Zones MT4 Indicator
-
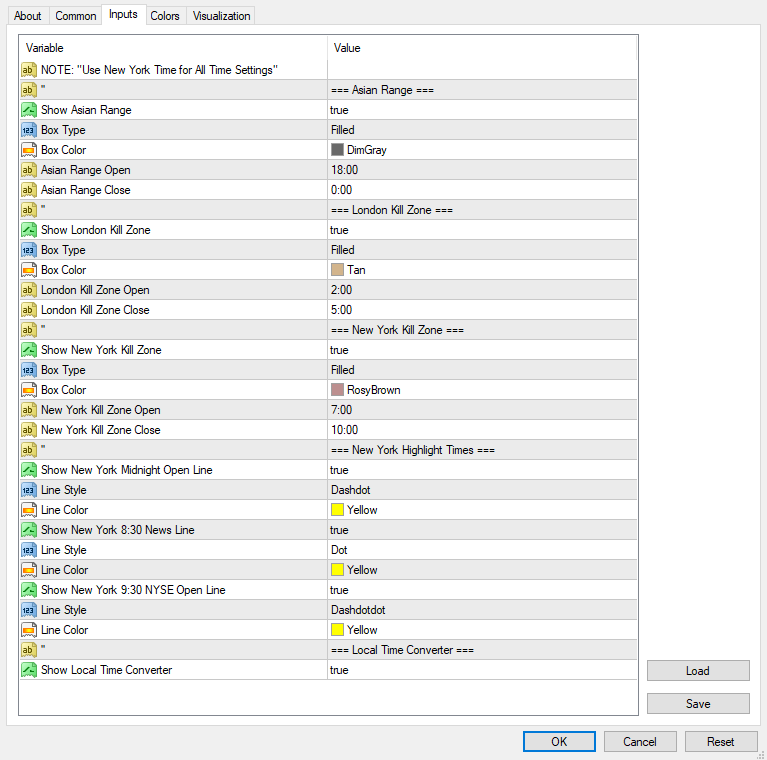
- ==== Asian Range ====
- show Asian Range – Choose to highlight the Asian range box
- Box Type Pick box outline or a box with a color filled
- Box Color Select the color you prefer
- Asian Range Open Choose the Asian range open time (Use New York time for all time settings)
- Asian Range Close Choose the Asian range closing time
- ==== London Kill Zone ====
- Display London Kill Zone – select either true or false to display the London open box
- Box Type – Select box outline or a colored box
- Box Color Choose the color you prefer
- London Kill Zone Open Choose the London open time
- London Kill Zone Close – Choose the London closing time
- ==== New York Kill Zone ====
- Display New York Kill Zone Choose either false or true to display the New York open box
- Box Type Choose box outline or a colored box
- Box Color Choose the color you want to use
- New York Kill Zone Open – Choose the New York open time
- New York Kill Zone Close – Choose the New York close time
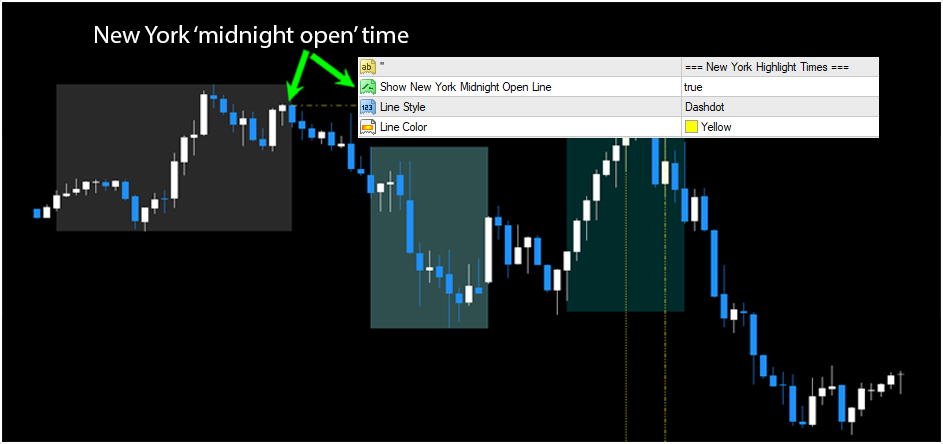
- ==== New York Highlight Times ====
- Display New York Midnight Open Line Choose true or false
- Line Style Choose the type of line (solid or dot, etc.)
- Line Color Choose the color you want to use
- Display New York 8:30 News Line Choose true or false
- Line Style Select the type of line (solid dot, solid, etc.)
- Line Color Select the color you want to use
- Display New York 9:30 Open Line of NYSE Choose either true or false
- Line Style Select the style of line (solid dot, solid, etc.)
- Line Color Choose the color you want to use
- ==== Local Time Converter ====
- Display Local Time Converter – Choose true or false (to toggle the candles hover windows either off or on). Move your mouse to the left-most point of any candle (or the wick) to activate the ‘candle hover’ window to display your local time and New York time on that candle.
A brief review course in (ICT) Kill Zones:
What are Kill Zones?
All ICT students are aware that certain hours of the day open excellent trade opportunities. ICT identified these times as the “Kill Zones,” which occur during the London and New York open sessions:
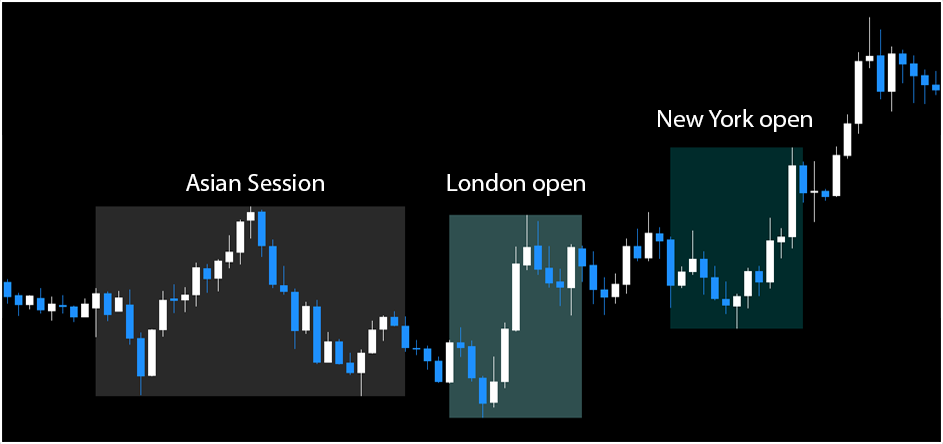
ICT has specified these session times for each day:
- Asian Session 6pm to midnight
- London Open 2am to 5am
- New York Open 7am to 10am
These sessions will be highlighted on the chart which makes it easier to spot possible trading setups in these crucial “kill zones”.
(Note Note that ALL times used to be used in this indicator are NEW YORK time)
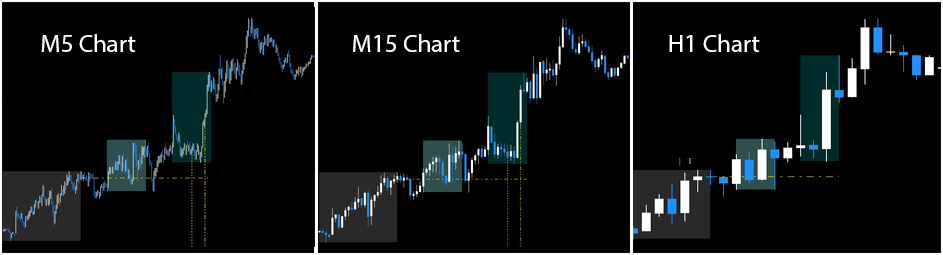
This indicator is intended to be seen in the M15 chart but it could also be useful for the M5, M30, or H1 charts:
What exactly are we seeking in these days?
Most of the time, we are looking for the most intelligent money to invest in “liquidity pools” that are that are located at the earlier pivot points (usually within the last session) to fuel their planned actions for the next day. For instance, if you were able to determine an average daytime preference for a certain instrument that was bullish (after your analysis of the higher timeframe) You would likely be seeking a bearish’stop hunt’ during the London open session:

It’s exactly what took place on the day. Note that price reached equal lows during the Asian session, and then returned to ‘road the liquidity that was there (in the form of stops for bullish traders and bearish traders waiting for “break out” orders) in the London open.
Once the liquidity was taken you can observe that “smart money” stepped into the market with huge bullish orders, pushing the price upwards quickly…
After the big bullish move during the London open, the price was able to consolidate for a short period of time. Let’s revisit this chart to find out what took place during the New York ‘Kill Zone’:
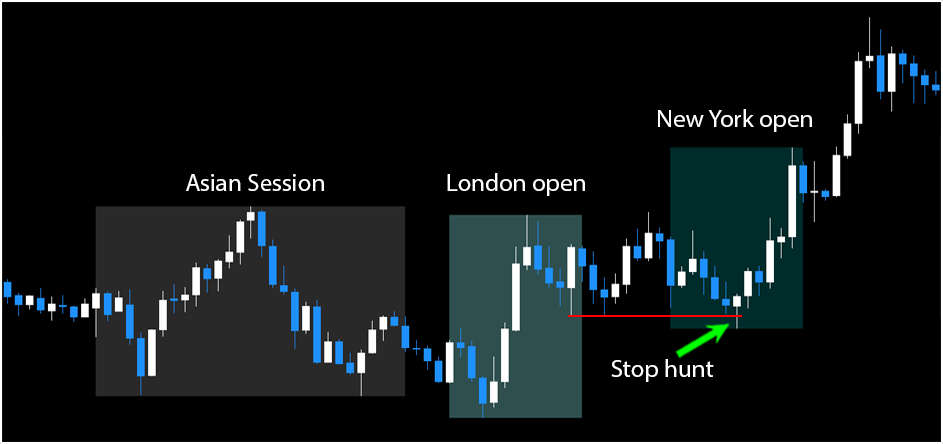
Price had reached similar lows while it was consolidating (engineered liquidity) but during the New York open price came back and again scoured the liquidity pool, after which it began to trend in a bullish direction for the remainder of the day.
If you take a closer look, you’ll notice that price created a series of triple-highs during the Asian and London sessions (more engineered liquidity) that were reflected during the New York session.
Note: These kinds of setups are not common often However, having these crucial “Kill Zones” marked in the M15 chart will help you identify these “perfect” setups when they do happen.
Indicator Display Options:
Local Time Converter
The built-in local time converter shows your current (computer) time on every candle. The indicator is synchronized with your computer’s time to create the local time converter’s “hover window’ (this helps you to confirm or compare your local time to your broker’s time and New York time)
- To see your local time, hover your mouse to the upper left corner of any candle (or the wick) to activate the ‘candle hover’ feature to display the local time (and New York time) on the candle:
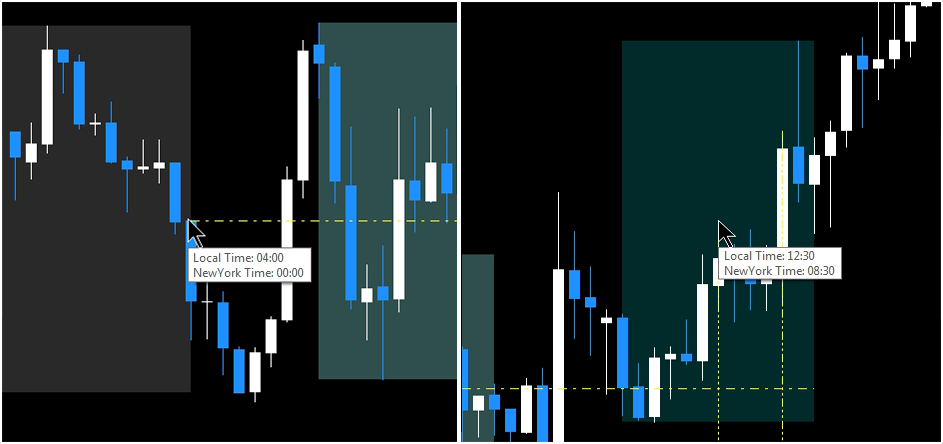
In the picture above you can see the local time converter ‘hover window’ in action:
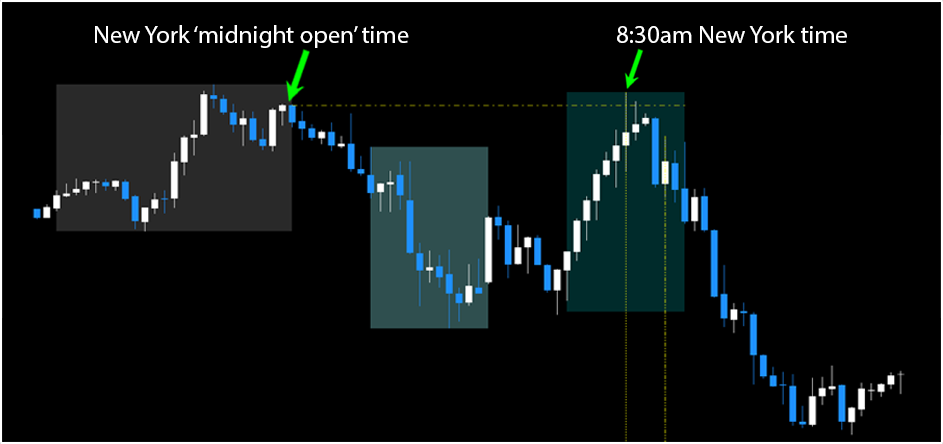
- The pic on the left shows your local time at the New York midnight candle
- The pic on the right shows your local time at the 8:30am New York candle
New York Highlight Times
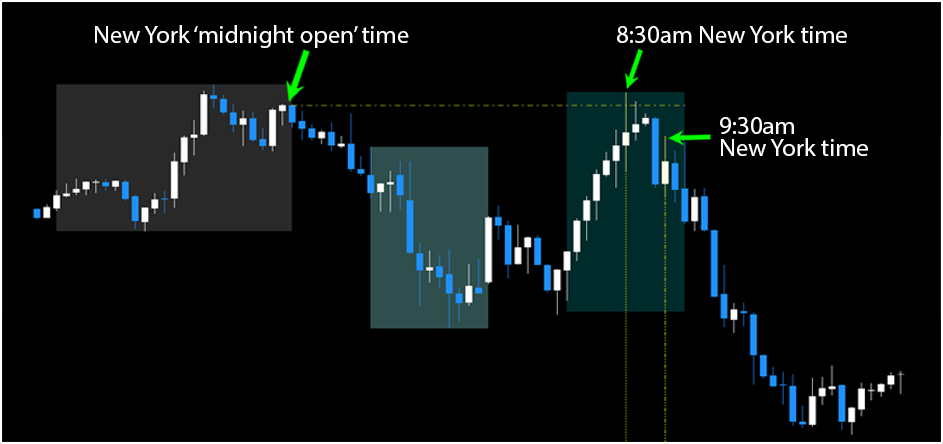
The “Kill Zones indicator will draw perforated lines of yellow on the chart of M15 to highlight:
- New York Midnight Open time – a yellow line which extends horizontally starting from the New York midnight (12am) candle until the end the New York open session
- 8:30am New York NEWS time – an orange line that runs vertically starting from the New York 8:30am candle (a potential trade setup with a high probability due to the important economic news being released at the time)
- 9:00am New York Stock Exchange (NYSE) open time is a yellow line running vertically starting from the New York 9:30am candle (the NYSE open time that can trigger large movements in US indexes that are based in the US)
The New York Midnight Open:
ICT has always surpassed the benefits of highlighting New York ‘midnight open’ time on your charts.
Note the following: Trade setups that use this New York ‘midnight open’ time are primarily USA that are based on Indexes and USD currencies.
The “Kill Zones indicator will draw perforated yellow lines along the chart of M15 to highlight:
- NY Midnight Open – a yellow line that runs horizontally from the NY midnight candle until the close of the New York open session
- 8:30am NY time – an orange line that runs horizontally starting from the NY 8:30am candle.
Bearish New York ‘Midnight Open’ trade setup (vice reverse for bullish):
- Bearish Daily Expectation
- Markets rise over the NY Midnight Open price at 8.30am (New York time)
- Price raises internal liquidity to the old highs, but then turns bearish
If you are anticipating a bearish move today, prices will likely increase above the open price of midnight at 8.30 am New York time:
In the image above, you will see that the price was above the New York ‘midnight open’ price (to take in internal liquidity) and then began to fall for the remainder of the day.
A few things to keep in mind:
- These kinds of setups will not happen every day however having these important “New York Times” displayed on the chart will help you to identify these types of instances when they do happen.
- If this trade setup happens, it may not occur precisely around 8:15am New York time (it can occur at any time during the New York open session)
- The highlight line at 9:30am is primarily used for USA -based Indices and does not typically impact currency pairs as significantly.