Works on Currencies, Stocks, Indices, CFDs & Cryptos too!
Currency Pairs Correlation Indicator TUTORIAL
Indicator Details
This indicator compares price correlations on up to 3 different instruments simultaneously. It was designed for comparing currency pair correlations but it also works on stocks, commodities and crypto currencies (whatever your broker offers in MT4). The only requirement is that each instrument must be on the same exchange so their trading hours match.
I designed this indicator to be very versatile. It can be used to trade many different strategies from scalping to hedging to simple trend-following based on an average trend direction of 2 or 3 currency pairs or it can signal only when all 3 pairs correlate on the same side of a particular moving average. The indicator automatically applies the same moving average settings on all 3 correlation pairs on the same time frame so the correlations are always relative.
Terms You Should Know…
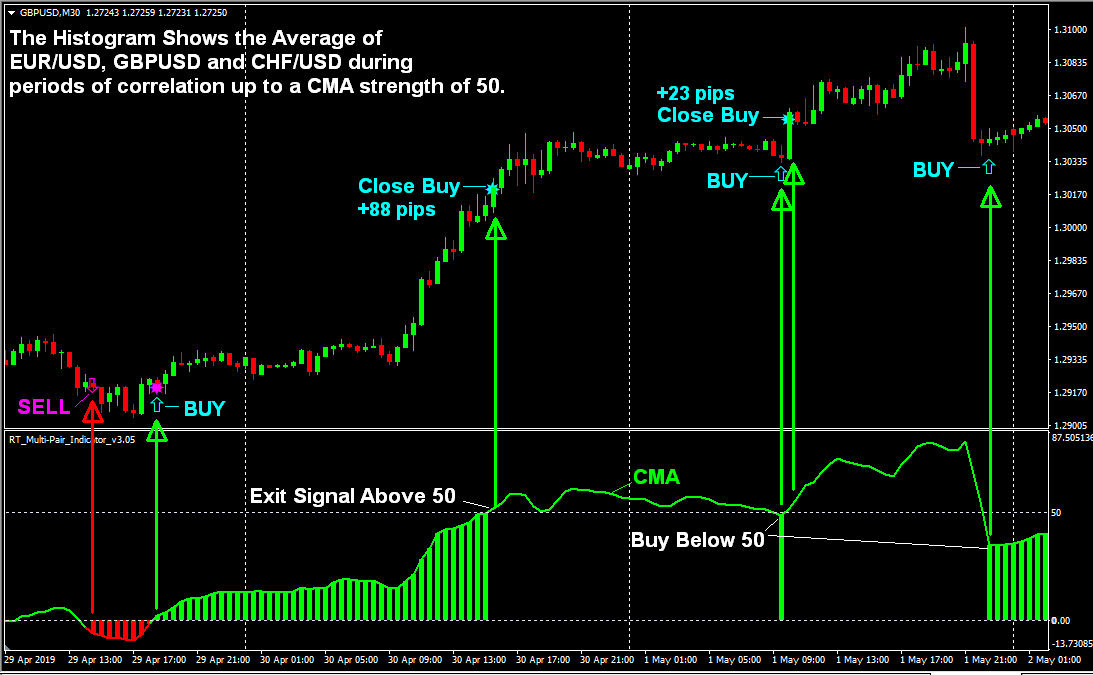
The term “IMA” stands for “Independent Moving Average“. IMAs are the colored lines in the indicator field and each one represents a different correlation pair. Since 3 pairs are referenced, there is IMA-1, IMA-2 and IMA-3 (the TradePair).
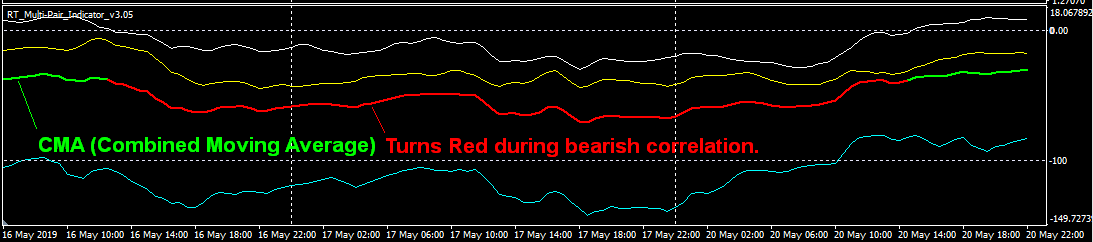
The term “CMA” stands for “Combined Moving Average” and it is the green or red line in the indicator field that represents the “Average Trend” of all correlation pairs included in the average (you may exclude the TradePair (IMA3) from the average).
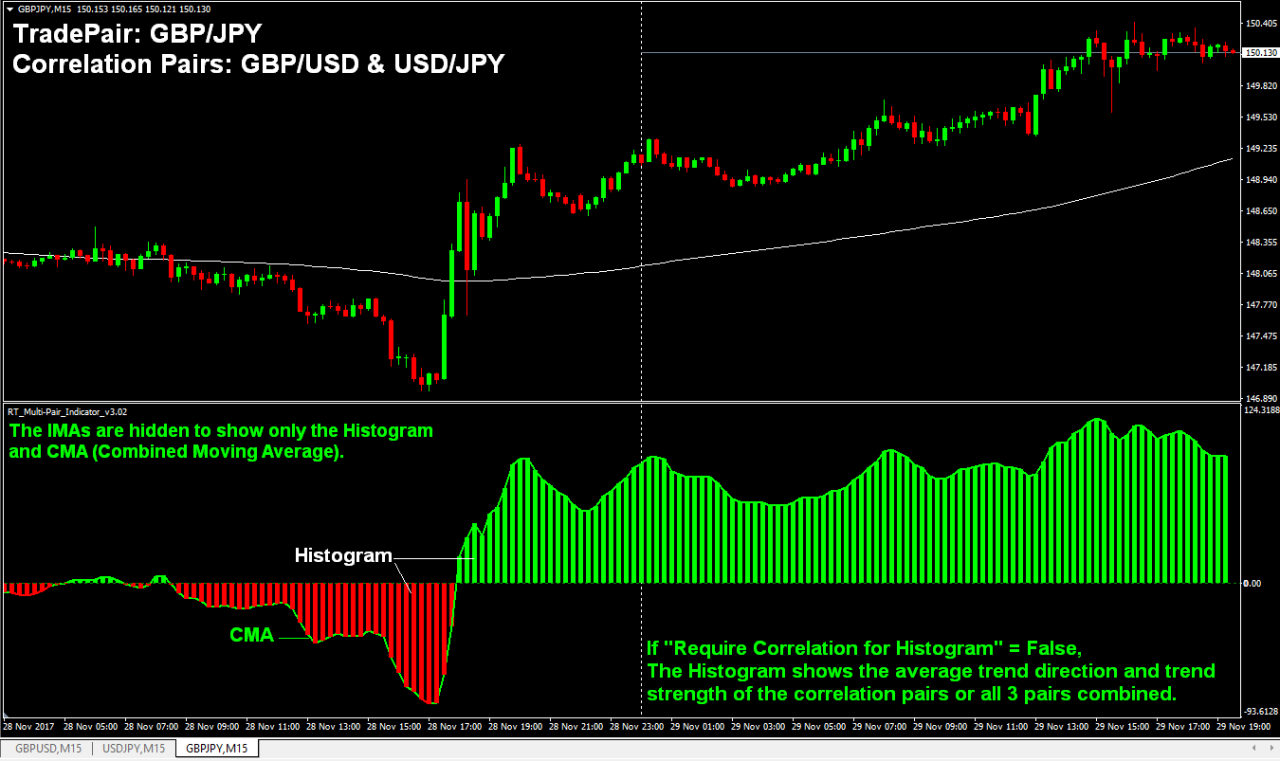
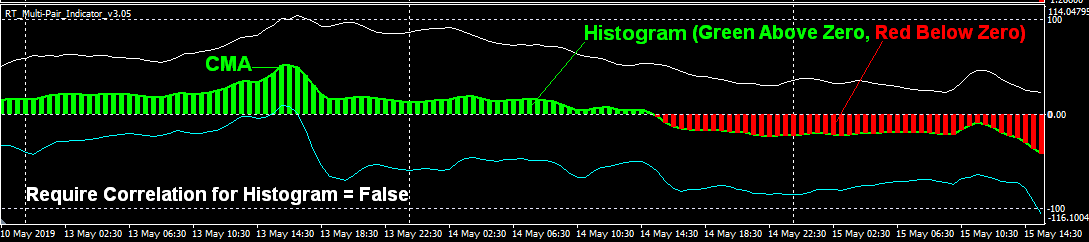
The “Histogram” is the red or green bars that extend out to the CMA line so the CMA and Histogram have the same value but each can be displayed independently. When “Require Correlation for Histogram” = True, the histogram will only be displayed during correlation on all 3 currency pairs pairs.
STRATEGIES…
Here’s just a few simple strategies you could use the indicator for.
Follow the Average Trend: This is the simplest use of this indicator. The histogram displays the average trend of 2 or 3 currency pairs. Simply open a trade on 1, 2 or all 3 pairs in the direction of the “Average” trend following the histogram (Buy during a green histogram, Sell during a Red histogram). It will generate a trade arrow when the Histogram turns from green to red, or red to green and you may reverse the arrow direction if you want to trade against the Histogram color (ie. Buy on red, Sell on Green). The example below is using the following moving average settings on a 30-Min chart: SMA 3, SMA 75, SMA 75.
Create a Mini EURO Index Against Other Majors.
Here is an average trend between EUR/USD, EUR/CAD, and EUR/AUD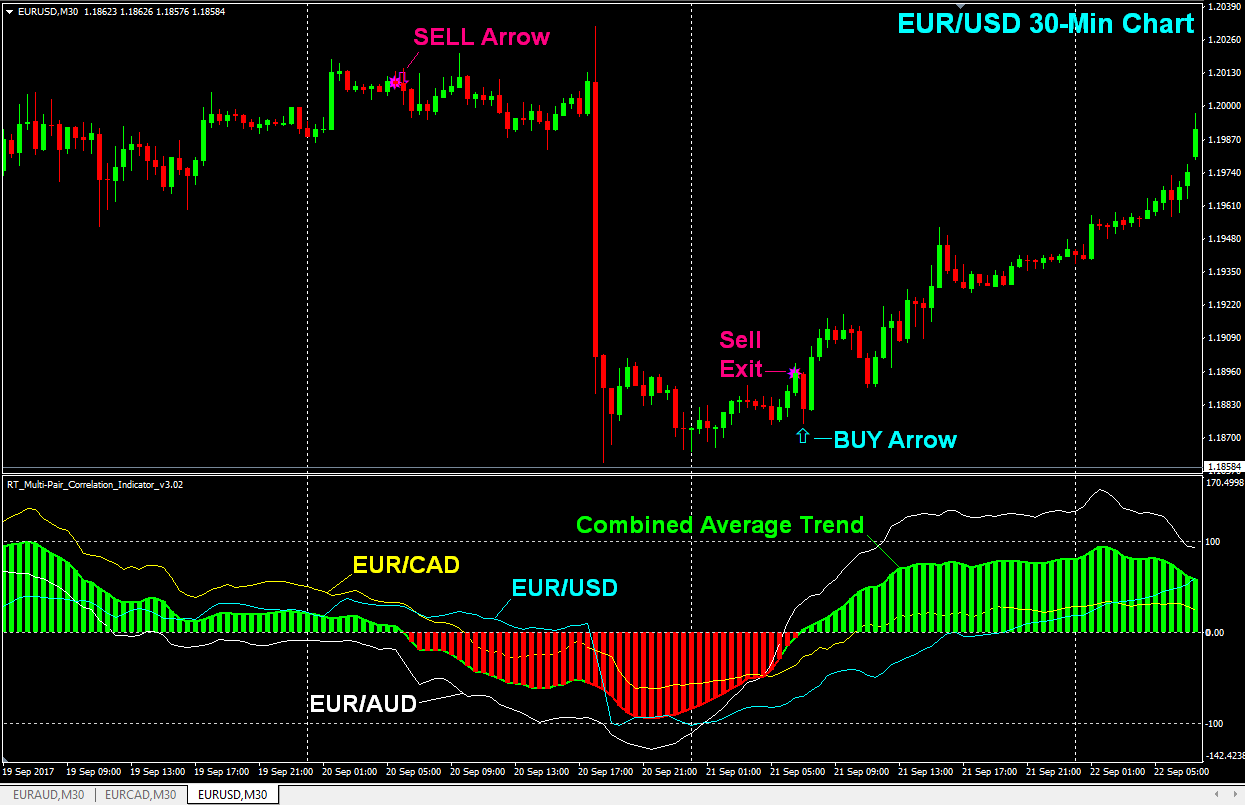
Trend-Riding the Highs and Lows: While following the average trend, you can set a Minimum and Maximum CMA/Histogram strength. When the histogram enters the window between the Minimum and Maximum CMA strength, it generates an entry signal. When it exceeds the Maximum Strength (in the direction of profit), it generates an exit signal. When price dips back below the Maximum Strength, it will generate another entry signal. For example, you may choose a trading window of 10-50 pips above the zero line and it will generate a buy signal when the histogram enters this window and exit signal when spikes above 50 on the scale. For sell signals, set a window of -10 to -50 and it will generate sell signals when the Histogram enters this strength window and an exit signal when the histogram drops below -50 on the scale, acting like a profit target that follows the trend and exits on spikes of profit.
In this example, the Histogram represents the average trend of EUR/USD, EUR/GBP, and EUR/CHF.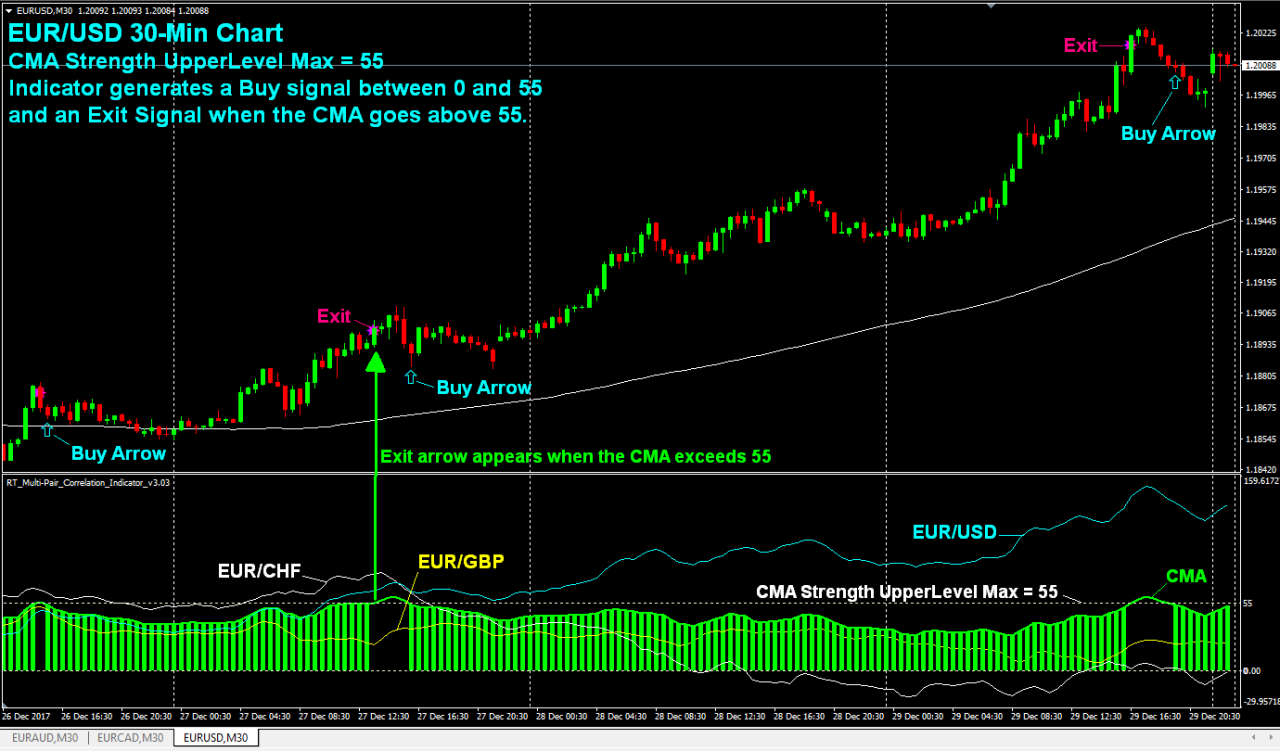
Trade Only the Strongest Pair: To reduce your exposure and maximize your ROI, you may choose to trade only the strongest pair in the direction of the histogram (the average trend). Using the chart above as an example, you would be long EUR/CHF (the white IMA line in the indicator field) up until the 2nd Buy Arrow. Then you would switch to a long position on EURUSD when the blue line (EUR/USD) crossed above the white IMA line (EUR/CHF) in the indicator field. IMAs are the colored indicators representing each correlation pair.
Trade with the Average Trend Only During Correlation: If you are only interested in trading the biggest moves with the highest probability of follow-through, you can trade only when 3 similar pairs are moving in correlation (all 3 pairs on the same side of the same moving average). Using a True/False switch, you can make the histogram and trade arrows only appear during periods of correlation. The indicator will generage a trade arrow and pop-up alert when the correlation begins and ends.
Constant Hedge: Open 2 trades in the same direction following the histogram on 2 pairs with reverse correlations like EUR/USD and USD/CHF. The histogram will show the direction of the stronger trending pair. For example, if the histogram is green, open a BUY on both currency pairs so you are hedged on USD. If the histogram is red, open a SELL on both pairs. The beauty of this strategy is that it is difficult to get large draw-downs because when one pair loses, the other usually wins. Your profit will result when one pair trends more than the other. If the 2 pairs you choose correlate (like EUR/USD and EUR/CAD) you can reverse the IMA value on one of the pairs so the histogram clearly shows the direction of the stronger trending pair.
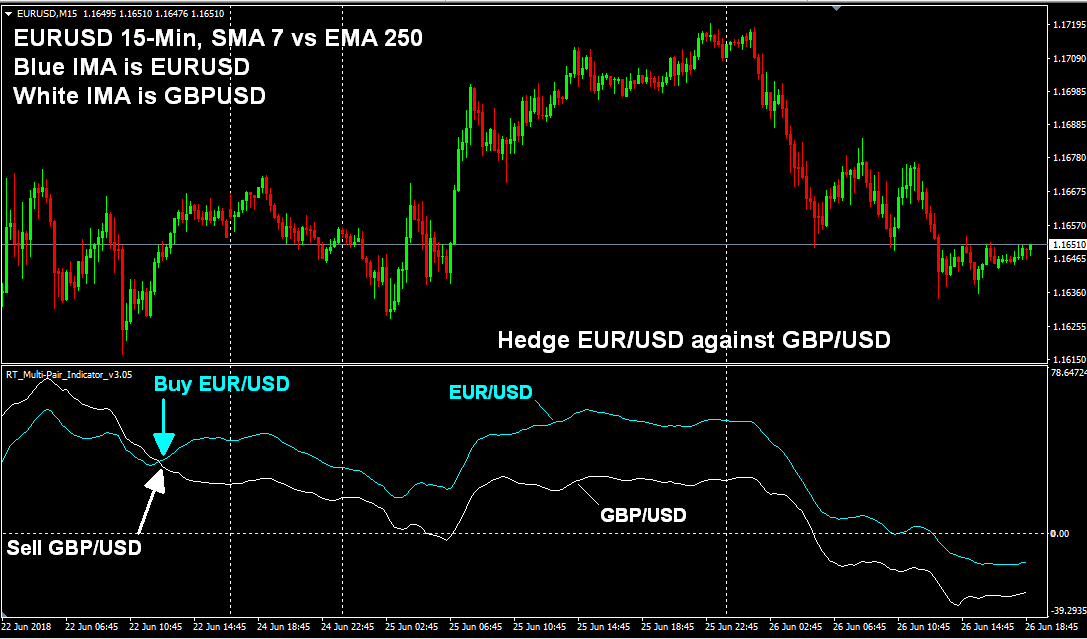
Hedge Correlating Pairs using the IMAs: Open opposite trades on 2 pairs that normally correlate like EUR/USD & GBP/USD or on two pairs with the same base currency like GBP/USD & GBP/AUD. Comparing their IMA strengths, open a BUY position on the pair with the stronger IMA and open a SELL position on the pair with the weaker IMA. When their IMAs cross in the indicator field, change your trade direction on each pair. You may set a profit target of “X” pips distance between each of their IMAs. For example, close both trades when their IMAs reach 75+ pips distance between them. Open new trades the next time their IMA lines cross. You may hide the Histogram and 3rd IMA for an easy-to-read 2-pair display (as shown below). Here’s an example of hedging EUR/USD vs GBP/USD using the IMAs…
Trade Non-Correlating Pairs for More Profit Potential: Open a trade on 2 pairs with reverse correlation like EUR/USD vs USD/CHF or GBP/USD vs USD/JPY. Comparing their IMA strengths, open a BUY on the more bullish pair and a SELL on the more bearish pair. You will NOT be hedged in this scenario but it offers more profit potential as they trend in opposite directions. When their IMA indicators cross, change your trade direction on each pair. Trading this strategy on pairs with reverse correlation gives you more profit potential than when hedging correlating pairs because the more they trend in opposite directions, the more you profit, often on both pairs but try avoid this strategy in choppy market conditions. You may set a profit target of “X” pips distance between each of their IMAs and the distance between them is essentially your profit (plus any amount they trended before hitting that target). For example, close both trades when their IMAs reach 100 or 200 pips distance between them and open new trades when their IMAs cross again. The Moving Average settings I like to use for this strategy is 2, 100, 100 on a 1-Hour chart.
CORRELATION SCALPING (GBP/JPY)
By mere accident, I discovered that this indicator is an excellent tool to identify scalping opportunities during correlations that should not really occur. When these correlations do occur, there is usually an exaggerated move on the TradePair followed by a quick correction the other direction. Simply exploit these exaggerated moves in the direction of the current trend for an additional edge. The indicator preset file for each scalping strategy is included in your purchase.
Scalping Strategy: Trade against singe-bar or multiple-bar counter-trend correlations in the direction of the underlying trend. Close the trade on short-term correlations in the direction of the underlying trend (the direction of profit).
GBP/JPY Scalping Strategy: This strategy can be done on any time frame (larger time-frames for larger moves) but for this example, you would open a GBP/JPY 15-Min chart with SMA 117 (to determine trend direction). Attach the correlation indicator and load the GBPJPY Scalping preset file (included with your purchase). The indicator will look for 1-candle correlations between GBP/USD and USD/JPY, which result in exaggerated moves on GBP/JPY.
Buy Signals: Enter Buys on a red histogram bar with a CMA strength of -3 to -12 when price is above SMA 117 (enters buys on correlated pullbacks). Close your buy on a green histogram bar of 7+ on the CMA Strength Scale (closes on a correlated bullish move) or a CMA spike of 12+ on the CMA scale (another chance to get out with a nice profit even without correlation).
Sell signals: Sell on a green histogram bar with a strength of 3 to 12 (Sells against a bullish correlation). Close the sell on a bearish correlation with a minimum CMA strength of -7 or a CMA drop of –12 or greater on the CMA scale (another chance to get out with a nice profit even without correlation).
Profit Target: Set a profit target of 30 – 60 pips, depending on current volatility.
Stop Loss: Set a 30 pip hard stop.
Trailing Stops: At +25 pips, move the stop-loss to -15.
Usually, you will get an exit signal before your profit target is hit but sometimes a valid exit signal doesn’t come in a timely manner when volatility drops so the trailing stops give you another chance to get out of the trade with a profit or a small loss.
This Correlation Scalping EA is now available HERE to automate this strategy for you. The name of the EA is “Trades Against Histogram Following MA4″ and it includes the preset files and template for this strategy. This strategy works best in strong trends and big moves following major economic announcements. It has proved too inconsistent to use long term through choppy market conditions so it should only be activated when large moves or trends are anticipated. Here’s some live trades using the EA on a test account Dec 5-6, 2017…
GBP/JPY SCALPING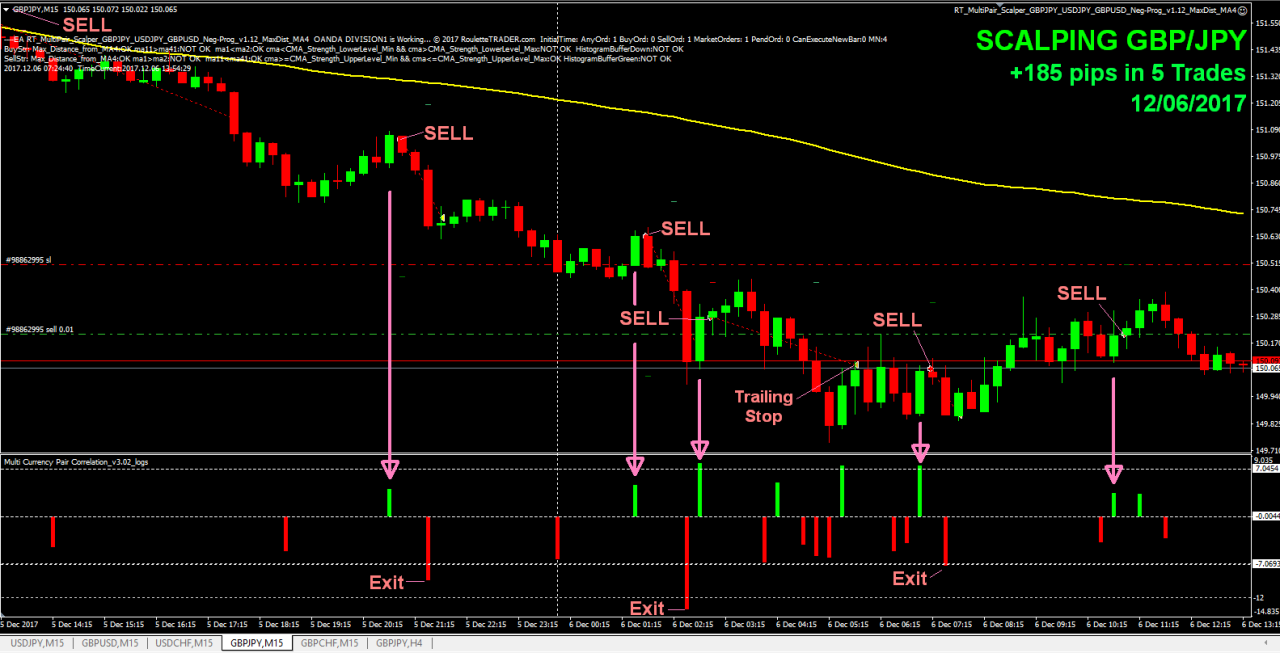
How the Indicator Works…
Here’s the primary parts that make up the indicator:
3 Moving Averages: The indicator automatically applies the same moving averages on the same time frame on each of the 3 correlation pairs (or just 2 pairs if you choose) then measures the distance between the moving averages to create an IMA (Independent Moving Average) for EACH of the 3 correlation pairs. An IMA is the moving average of the 3 Moving Averages on a single correlation pair. Having 3 points to measure from (3 moving averages) gives you a lot of flexibility. In the indicator settings, these moving averages are named: MA1, MA2, and MA3. For a simple trend-following strategy, I normally leave MA2 and MA3 as equal values (as shown below) so I can easily understand the average trend direction and strength.
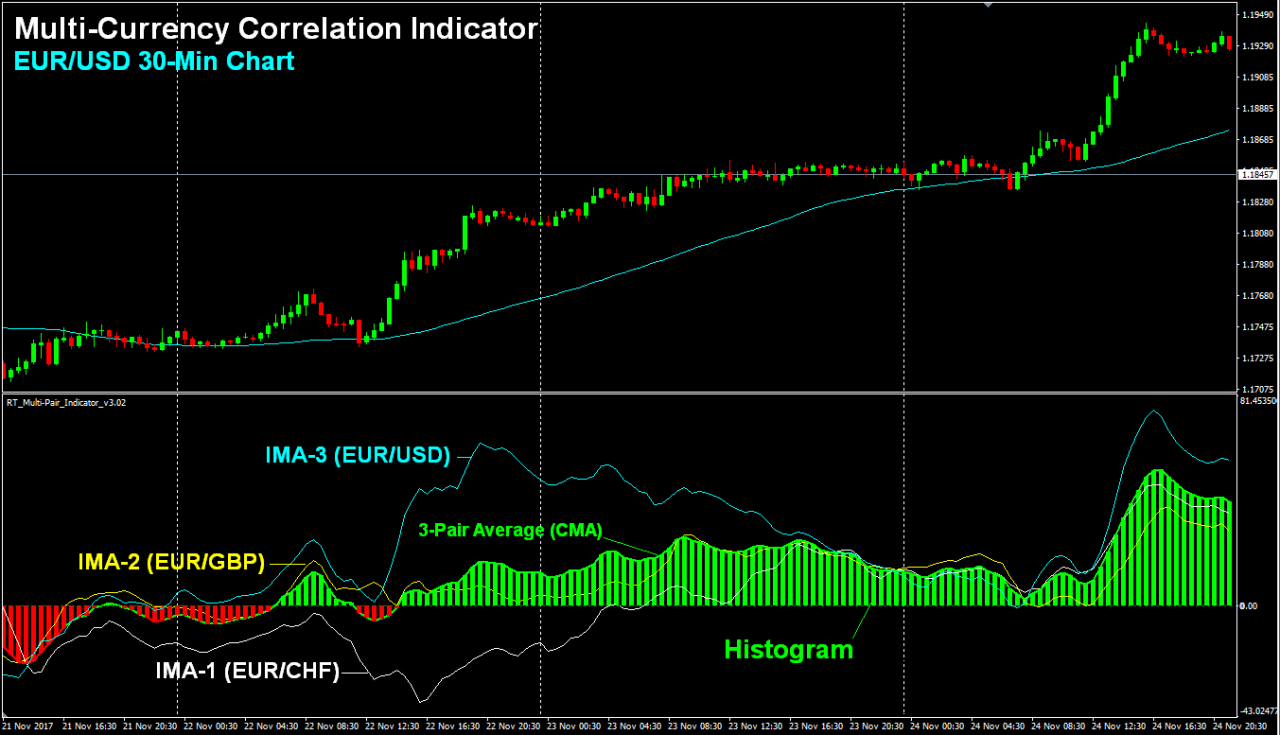
Moving Average Settings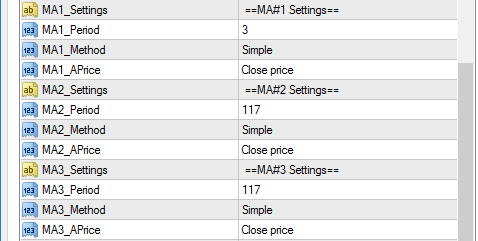
IMAs (Independent Moving Averages): The Moving Average settings above are used to create the 3 IMAs. Each of the 3 colored IMAs represent a different correlation pair and shows the trend strength and direction of that pair. Each IMA is plotted as a separate colored line in the indicator field along the bottom of chart of the pair you’re trading. With all 3 IMAs in one location, you can easily see how each currency pair is moving relative to each other. You have the option to display the IMAs or hide them. An IMA below the zero line means the sum of the IMA formula is negative (indicating a down-trend) and an IMA above the zero line means the sum of the IMA formula is positive (indicating an uptrend).
IMA Display Settings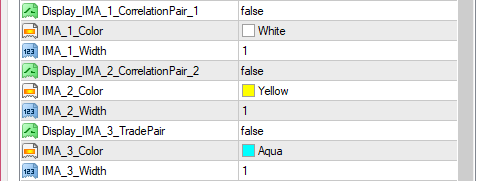
The 3 IMAs Displayed (USD/CHF value is reversed to show USD correlation)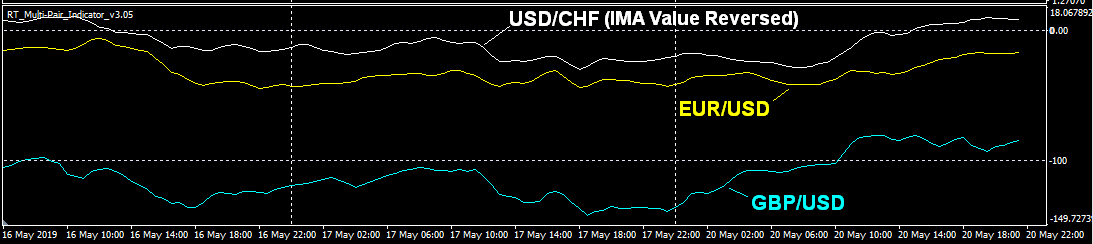
CMA (Combined Moving Average): The CMA is the green or red moving average in the indicator field and it is the average of all 3 currency pairs, or just 2 pairs if you choose to exclude the TradePair. The default color is green. However, during periods of correlation, the CMA turns bold green above the zero line and bold red below the zero line during correlation. You can average the CMA value by 1, 2 or 3 depending on the number of currency pairs you are comparing.
CMA (Combined Moving Average) Settings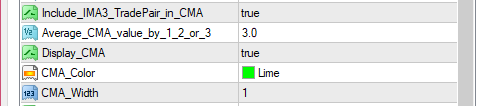
Histogram: The Histogram and CMA will always have the same value. But with a True/False switch, the Histogram can represent two different things. When “Require_Correlation_for_Histogram = False”, the Histogram merely represents the average trend direction of all correlation pairs included in the CMA value. The Histogram turns green above the zero line and red below the zero line. The Zero Line in the display represents the average of MA2 and MA3 in your settings. When the Histogram turns green (above the zero line), it means MA1 is above the average of MA2 and MA3 across all 3 pairs. When it turns red, it means MA1 is below the average of MA2 and MA3 across all 3 pairs.
Histogram & Correlation Settings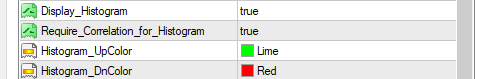
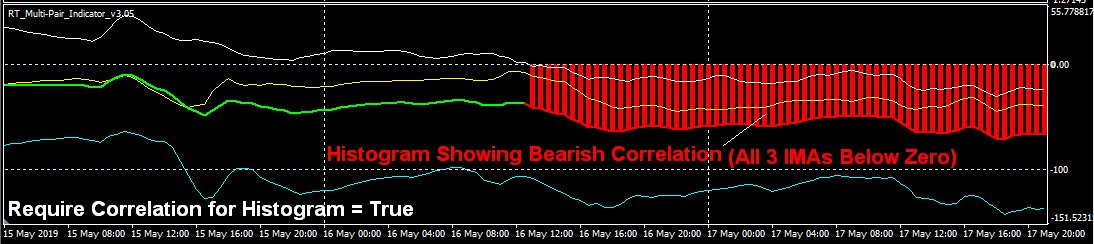
Histogram During Correlation: Correlation occurs when MA1 is on the same side of MA2 and MA3 on all 3 pairs simultaneously. This is usually displayed as all 3 IMAs on the same side of the zero line. To identify when correlation is occuring, set “Require_Correlation_for_Histogram = True” and the Histogram will only appear during periods of correlation between all 3 currency pairs so you can easily see when correlation is occurring. The trade arrows and signal alarm will occur any time the first bar of the histogram appears, which means you can set it to signal only during times of correlation if you want.
CMA Strength Min/Max: The histogram will only appear when the CMA value is within these specified ranges on each side of the zero line. UpperLevel is the scale above zero and LowerLevel is the scale below zero and you must use negative numbers for the LowerLevel. The Minimum Strength helps filter out weak false signals during choppy low-volatility market conditions. The Maximum Strength stops the Histogram from appearing when the CMA value (Average Trend Strength) gets too strong and it works like a profit target. When the Histogram appears, you ge an Entry Arrow on the chart. When the histogram stops or changes color, you get an Exit Arrow on the chart, but this would be the simplest use of this indicator. There are many more strategies it can be used for, as you will see in the coming EAs that auto-trade off of this indicator.
CMA/Histogram Strength Settings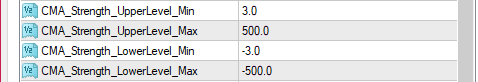
Trade Arrows: The Trade Entry arrows appear in the larger candlestick area of the chart when the Histogram appears and purple Exit Stars appear when the Histogram stops. You have the option to reverse the trade arrow direction and also hide the arrows if you don’t want to see them. You may also enable/disable the audio alerts and pop-up alerts when a signal occurs.
Here are some more examples of how the indicator can be used…
Create a Mini EURO Index with EUR/USD, EUR/GBP and EUR/CHF.
The Histogram & CMA show the Combined Moving Average of the 3 pairs
Correlation Required for Histogram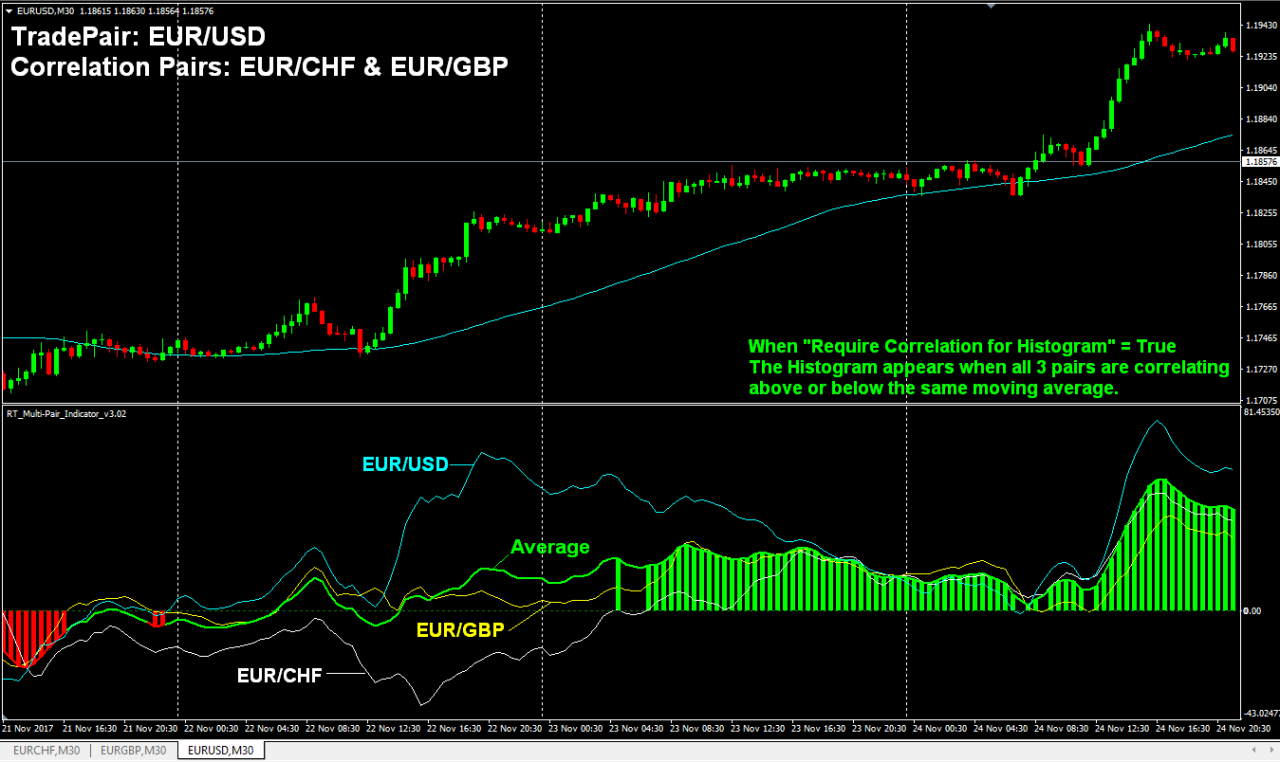
During a Down-Trend (Correlation NOT Required for Histogram)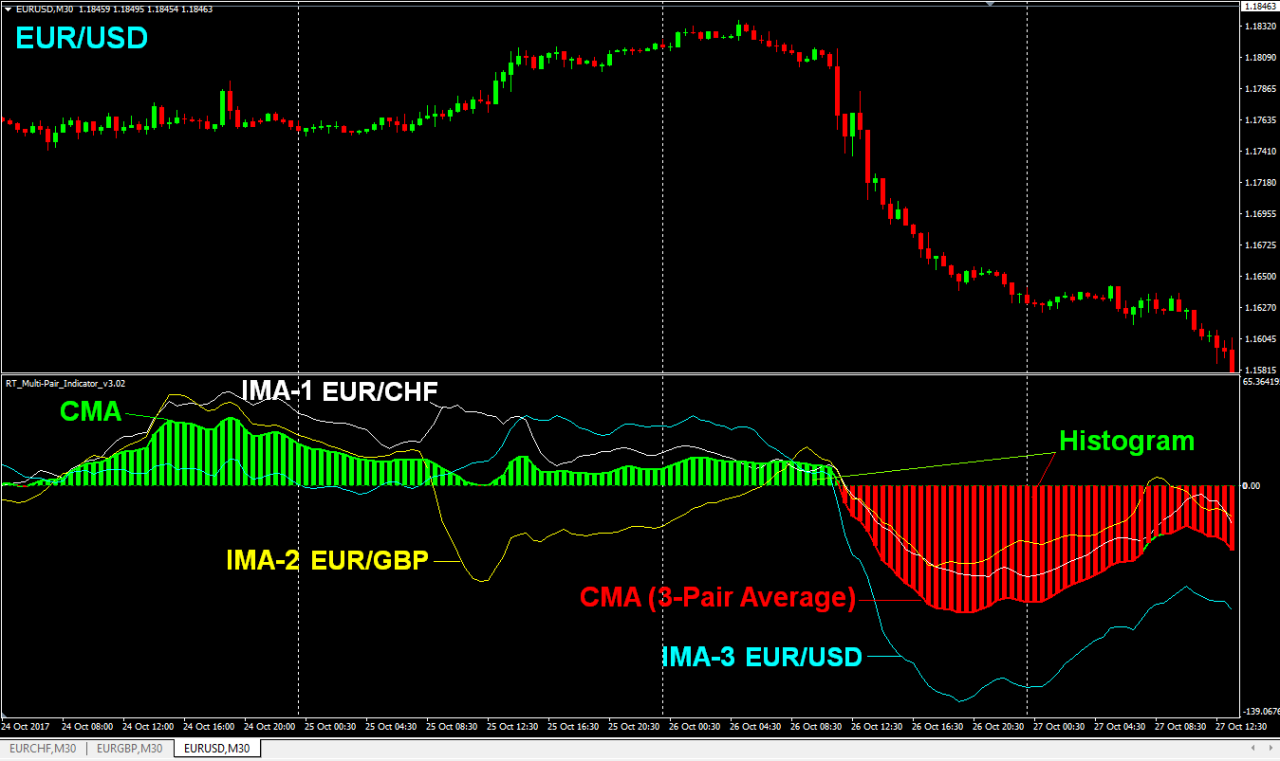
The CMA & Histogram show the combined
average of GBP/USD & USD/JPY on a GBP/JPY Chart