Forex traders use an IFT (Inverse Fisher Transform Of One More Average Relative Strength Indicator) indicator called the OMA RSI. Some traders use the technical indicator “Fisher Transform” to detect price movements that are trending.
To detect a price trend that may be reversing, the Inverse Fisher Transform is used. the RSI line crosses below a specific level on the indicator. This is considered to be a bearish signal. When it crosses another level, it is considered a bullish signal. Technical traders use this signal to manage risk and trade.
OMA RSI Buy/Sell Signal IFT
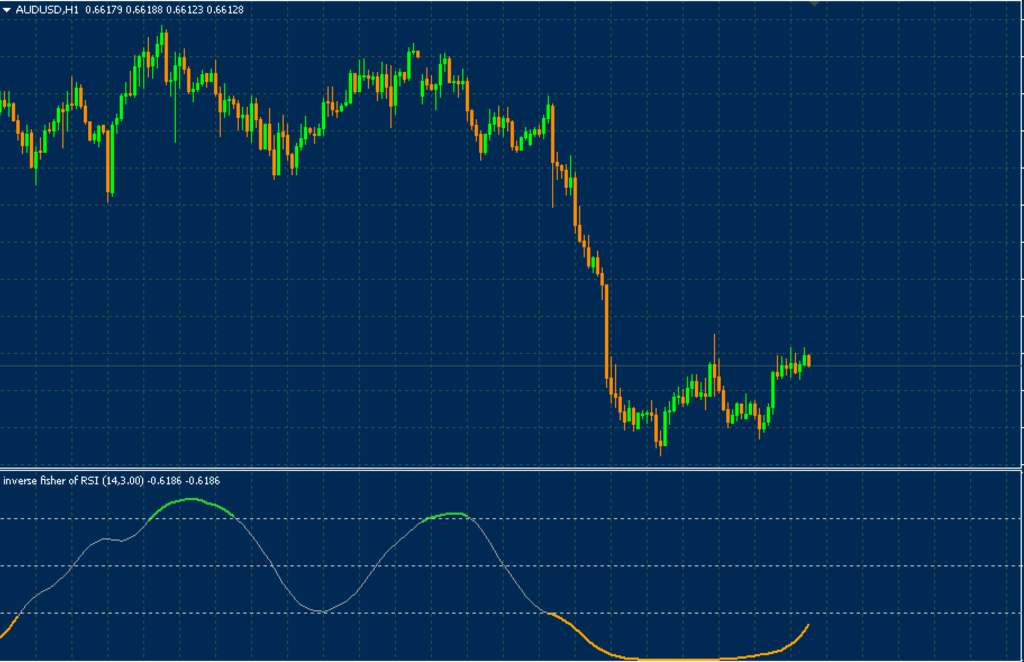
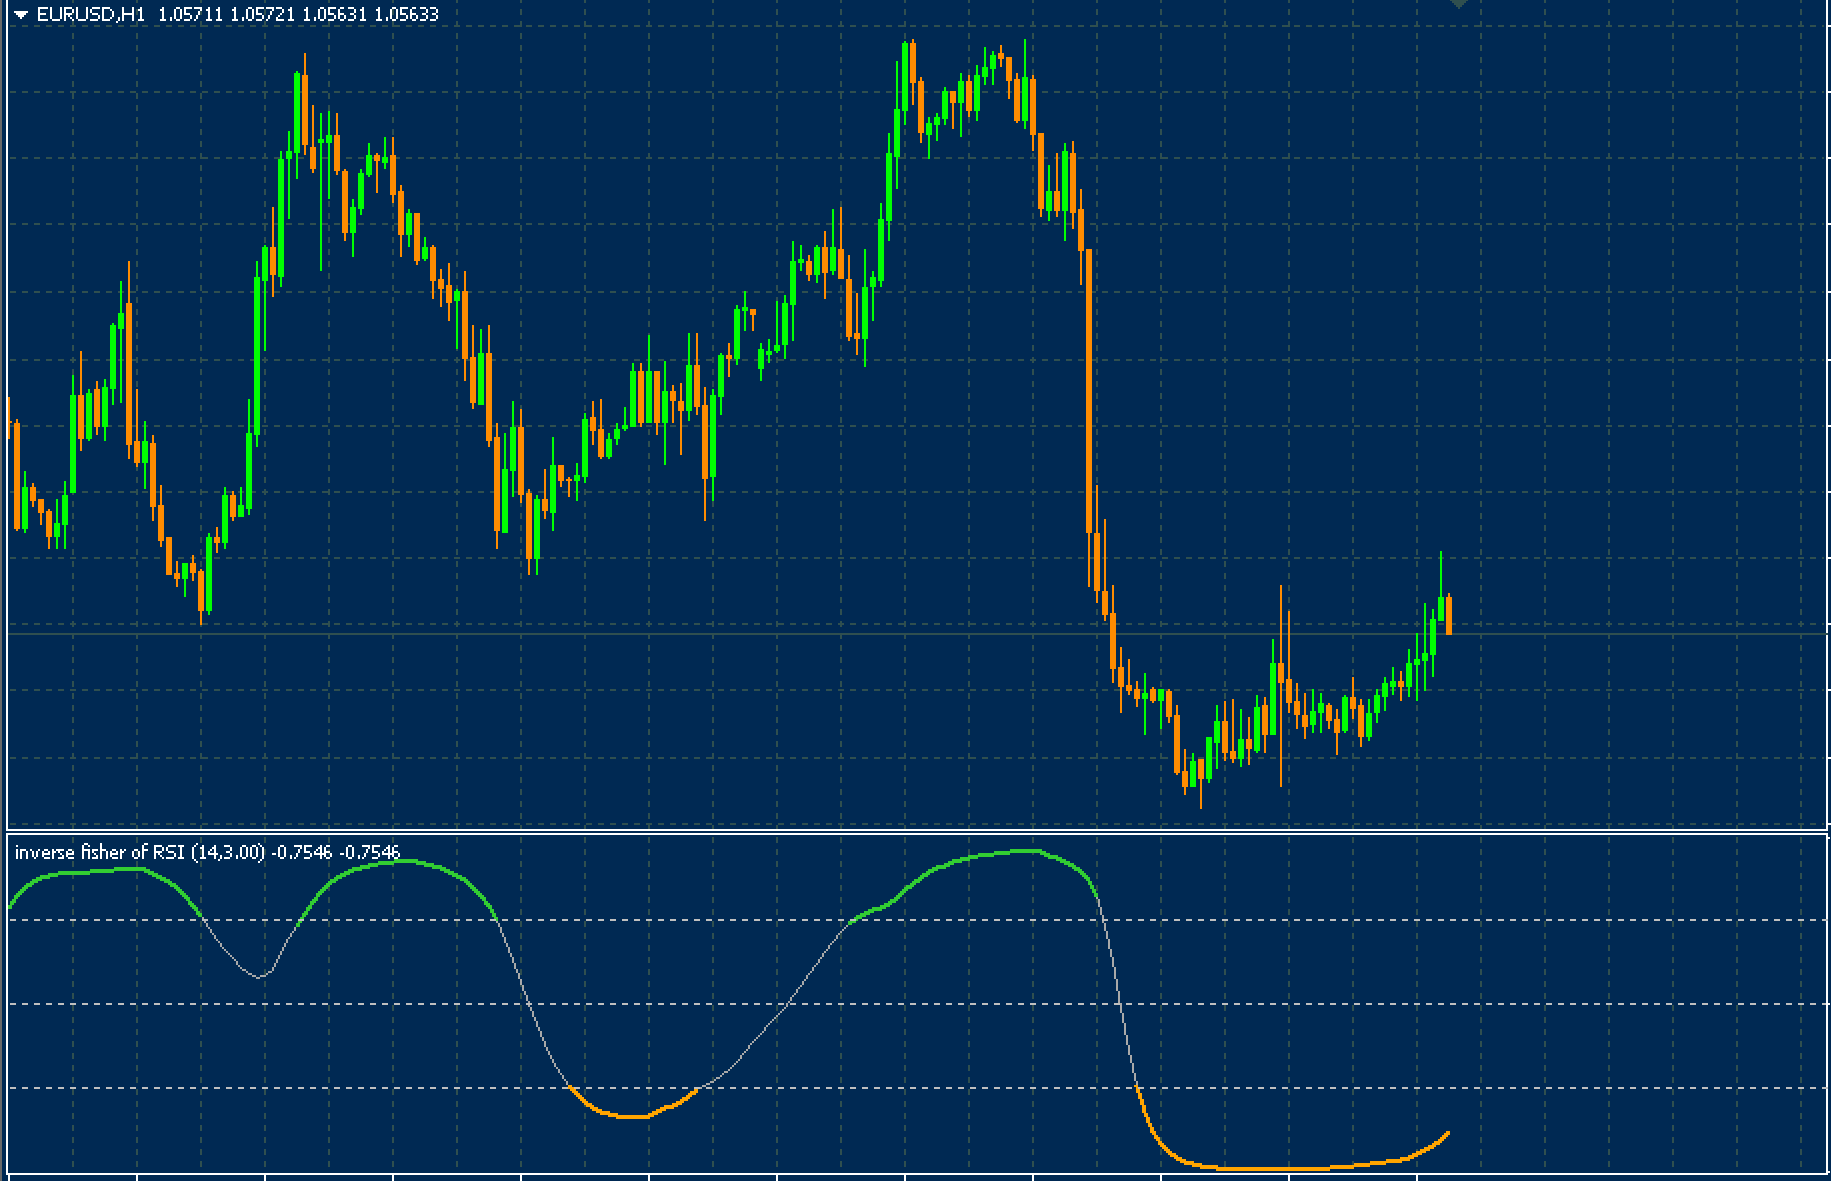
The OMA RSI IFT is a technical indicator that can help identify market trends and potential reversals.
You will see the indicator as a graph. It ranges from -1 to 1.
If the indicator is greater than 0.5, this indicates an upward trend in price. A crossover at this level could trigger a sell signal
If the indicator is below -0.5, this means that the price will be bearish. If it crosses the horizontal line (0.5), a buy signal may be triggered.
Conclusion
In order to detect possible reversals in the price trend, the inverse Fisher transform of the OMA RSI can be used. This information can be used by traders to identify oversold or overbought conditions and to make better trading decisions.