Technical Analysis PDF Free Guide
Technical analysis is the process of predicting the price movements of different markets such as currency pairs. It is used to assess securities and identify potential trading opportunities through the analysis of trading statistics and information.
You can increase your chances of success by using technical analysis to discover and execute trading strategies.
This post provides a clear overview of the technical analysis. Learn what technical analysis is and how you can apply it to your trading strategies. This guide is for both new and experienced traders. Let’s get started!
Table of contents
What is Technical Analysis (TA)?
Technical analysis trading involves analyzing charts and graphs in order to understand price movements.
These visual representations can be used to evaluate Forex pairs and other markets. This is done by analyzing prices and statistics to predict future trends.
Technical analysts are firmly convinced that the market price accurately reflects all information. Instead of relying on the fundamentals, they focus on price movements.
Popular technical analysis techniques include using indicators such as moving averages or the MACD to analyze raw price movement, as well as implementing swing and trend trades. These strategies can help you make better decisions and find profitable trading opportunities.
Technical Analysis and Fundamental Analysis
Fundamentals are used by most traders who invest over a longer period of time. They are assessing the value of a Forex pair, a stock, or any other market. Investors are looking at everything, including upcoming announcements and balance sheets. They also consider what the future value of a stock could be.
Technical analysis does not take into account this information. Technical analysis traders will use charts and other statistics in order to make trades. Price trends, indicator data, and chart patterns are all information that a trader using technical analysis takes into consideration.
How to Start with Technical Analysis
It’s easy to get started in technical analysis trading, but there is still a lot of room for improvement.
Demo trading charts are available for free. It allows you to learn basic technical strategies without putting your real money at risk.
You can practice your technical analyses in a no-risk environment. It is an excellent foundation to build on before moving on to more advanced strategies.
Trading with Technical Analysis
Understanding different strategies and being able to apply them is necessary for a person to become proficient in technical analysis. You can choose to focus solely on price movements, combine them with indicators, or explore different trading methods.
Keep these factors in mind, regardless of the strategy you choose:
- Develop a reliable strategy for managing risk and reward.
- Create a plan that will allow you to handle losses while generating overall profits.
- Set clear and simple trading rules.
- Track your trades, and adjust to the changing market conditions.
It can be difficult to develop precise rules when executing trades, but this is essential for consistent and repeatable outcomes. A well-defined trading strategy can be very helpful.
Not all trades in technical analysis will be profitable. It is important to develop a trading system that can take losses and still generate profits consistently over time. You can achieve success by focusing on the long term.
The Best Indicators
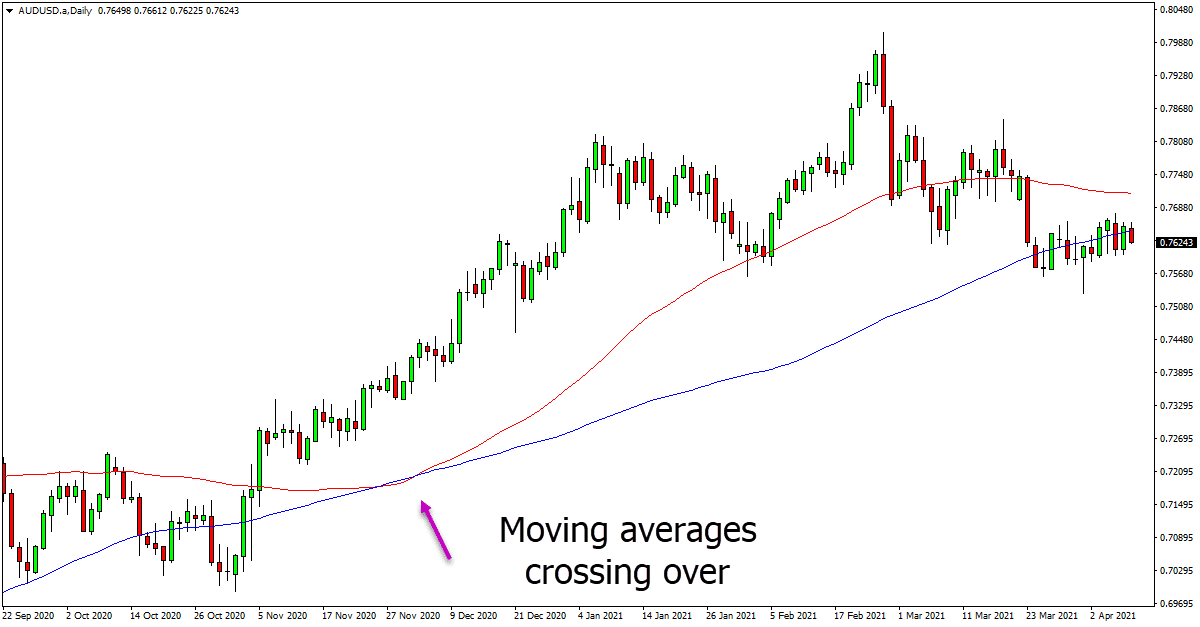
Moving Averages
In technical analysis, moving averages are a widely used indicator. They are useful in smoothing price fluctuations, identifying trends, and determining key support and opposition levels.
Combining moving averages can improve your trading signals.
A moving average is the average price for a certain period. As an example, the 14-period average moving average displays the average price over the last 14 periods as a straight line on the chart. This line shows the overall price direction for that timeframe.
Simple Moving Averages and Exponential Moving Averages are the two most popular moving averages. Traders often use these indicators to analyze price movements and make informed decisions.
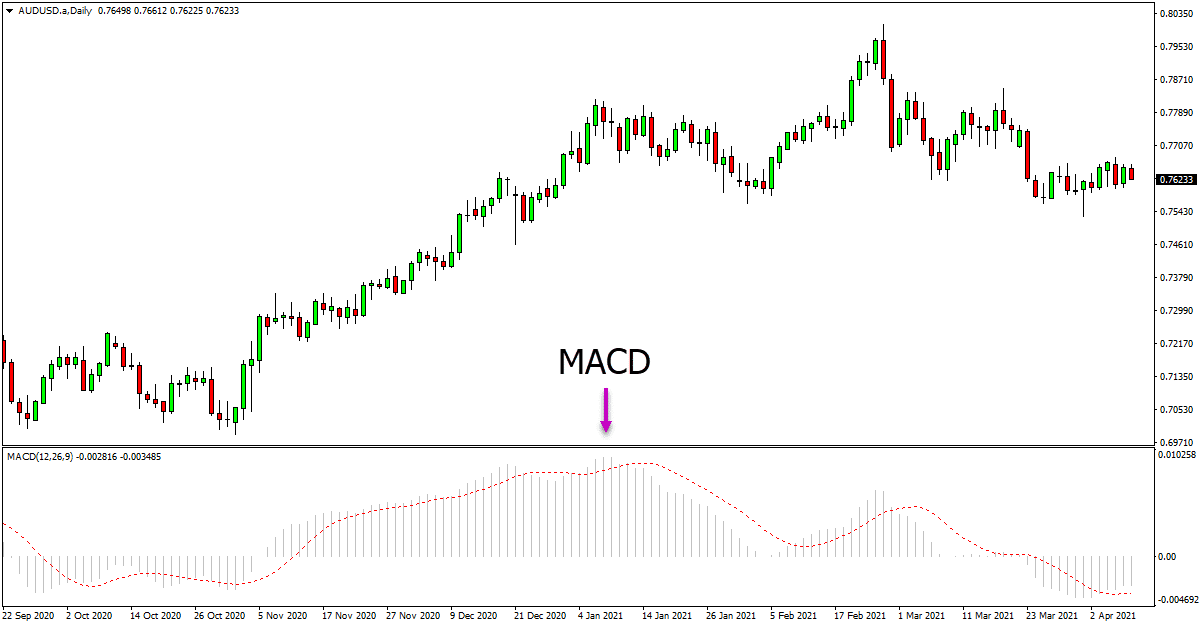
MACD
The MACD indicator is a popular tool for identifying new trends and momentum in many different markets.
The MACD is composed of three main parts:
- The MACD line is calculated by subtracting a longer-term EMA from a shorter-term EMA.
- Signal line: Used to generate buy-and-sell signals.
- Histogram: measures the distance from MACD to its signal line.
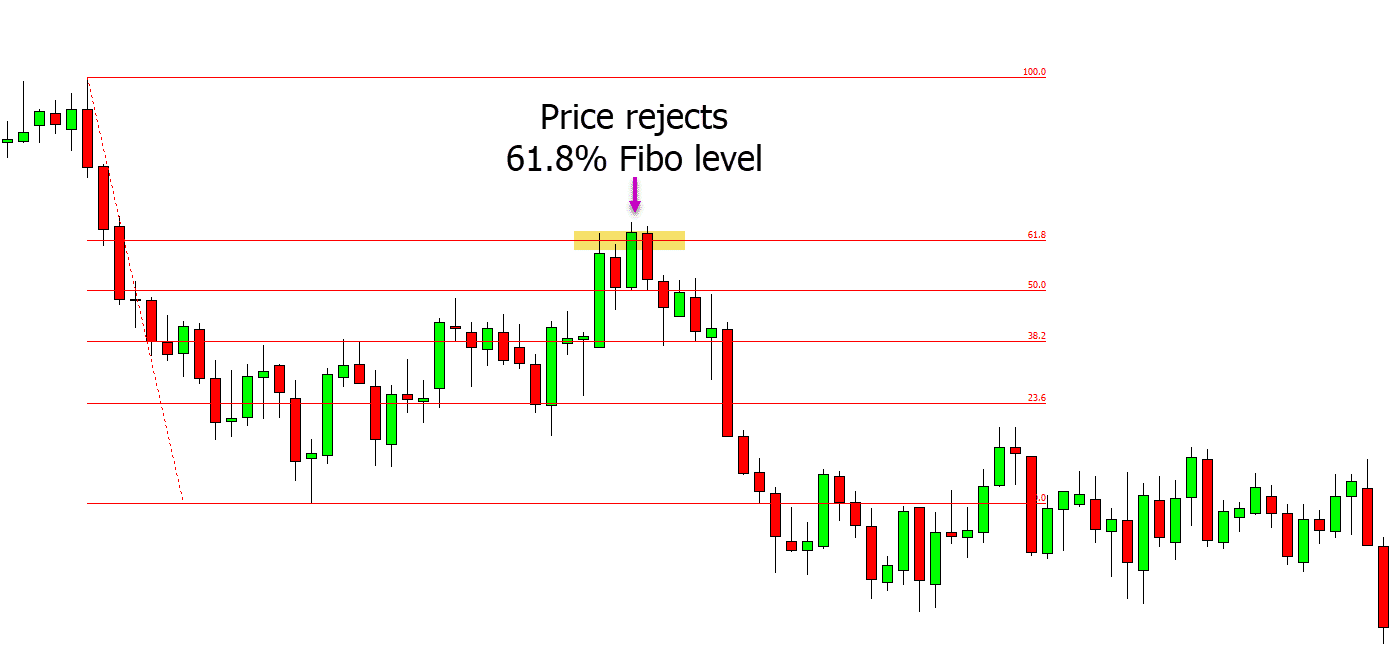
Fibonacci Tool
Fibonacci is a tool that you can use for both making and managing your trades.
Fibonacci can be formed by a series of ratios that includeThe percentages 23,6%,38.2%,50%,61.8%, or 100%.
These levels can be used as important levels of support or resistance.
Below is an example Price on a downward trend. Price moves up to 61.8% Fibonacci after trending higher. It finds resistance at this point and continues to sell lower in line with the trend.
Exploring Advanced Techniques
Using advanced technical analysis to improve your trading technique involves combining multiple methods and strategies. It can involve combining multiple indicators or integrating price action strategies with indicators.
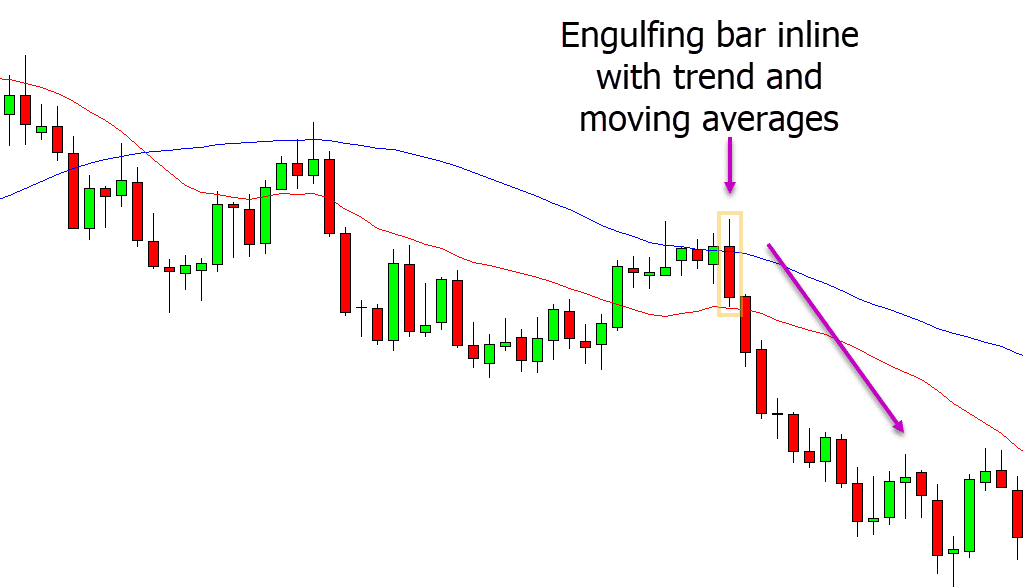
Take, for instance, the combination between moving averages (averages) and price signals.
It is suggested that short trades can be made when a moving average cross indicates a downtrend and the price has formed a bearish engulfing candle, which signals a possible drop in price. This is just an example of how to combine strategies for more advanced analysis.
You can combine many strategies to perform a more sophisticated technical analysis. You can improve your trading decision-making by expanding your toolkit.
Recap
Technical analysis can be used to predict price movements, identify trading opportunities and forecast future trends in different markets. You can improve your trading decisions by utilizing insights from technical analysis.
We have tried to provide a clear, practical explanation of technical analysis in this article. The information provided here can help refine your trading strategy and improve your trading skills, whether you are an experienced trader or a novice.
This is a continuous learning process, which requires constant practice and adaptation to market changes. By incorporating principles of technical analyses into your trading, you will be able to better understand market dynamics and make more educated trading decisions.
![PipFinite Volume Critical [Indicator Reviews]](https://mq177.com/wp-content/uploads/2023/05/5374034a40c8d6800cb4f449c2ea00a0-6.jpg)
what is ketorolac tromethamine
what is ketorolac tromethamine
ivermectin kinetic analysis
ivermectin kinetic analysis
minoxidil clinical data
minoxidil clinical data