How to use the Relative Strength Index document
The relative strength indicator is an easy-to-use and convenient tool in your trading.
You can use the indicator to determine if a particular market is overbought or oversold. Then you can make trading decisions.
This post explains what relative strength is and how to use it for your trading. Learn how to add it to your MetaTrader charts, and how you can find buy and sell signals.
Table of Contents
What is Relative Strength Index?
The relative strength indicator is also known as the RSI. It is a technical tool that helps you determine the market’s momentum.
The relative strength indicator adds an oscillator to your chart.
This oscillator is a 0 to 100 rotator. The two numbers that traders are most interested in with the RSI, 30 and 70, are the main ones.
It is believed that the price has overbought when it starts to move above 70. When the price drops below the level of 30, it is considered that the market is oversold.
You can use these levels to start predicting potential market reversals if the price is overbought.
How to Use the RSI
As the number of closes that are positive increases, so will the RSI. It will, however, fall as losses increase.
This information will be smoothed out by the relative strength index, which gives you an easy-to-read oscillator.
Here you can learn how to calculate relative strength. But when you use a tool, these calculations will be done for you. You only have to pay attention the key levels.
Created in 1978, the relative strength index is one of the most widely used indicators by traders who use price action and technical analysis.
We will show you how to combine the RSI with other trading techniques.
The RSI has become so popular because it’s easy to add and use in your trading.
Relative Strength Index Trading Strategies
The RSI indicator will give you an oscillator that moves upwards and downwards.
When using the RSI, we pay attention to the 30 and 70 levels.
When we look for bullish reversals in the market, we watch to see if the price moves below 30. This could indicate that the price has been oversold and a possible reversal higher is on the cards.
We are looking for bearish reversals when the RSI begins to move above 70. The price could be overbought if it moves above 70.
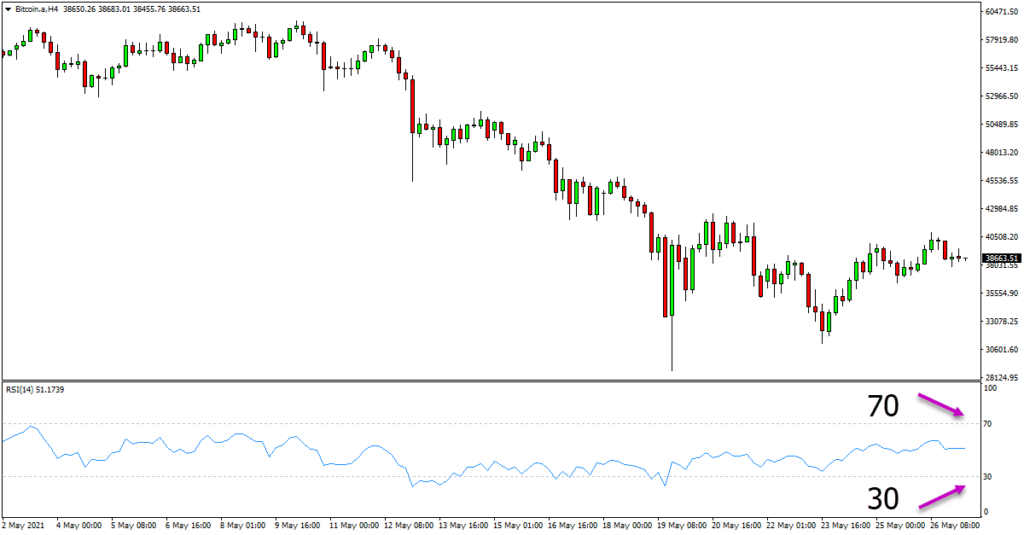
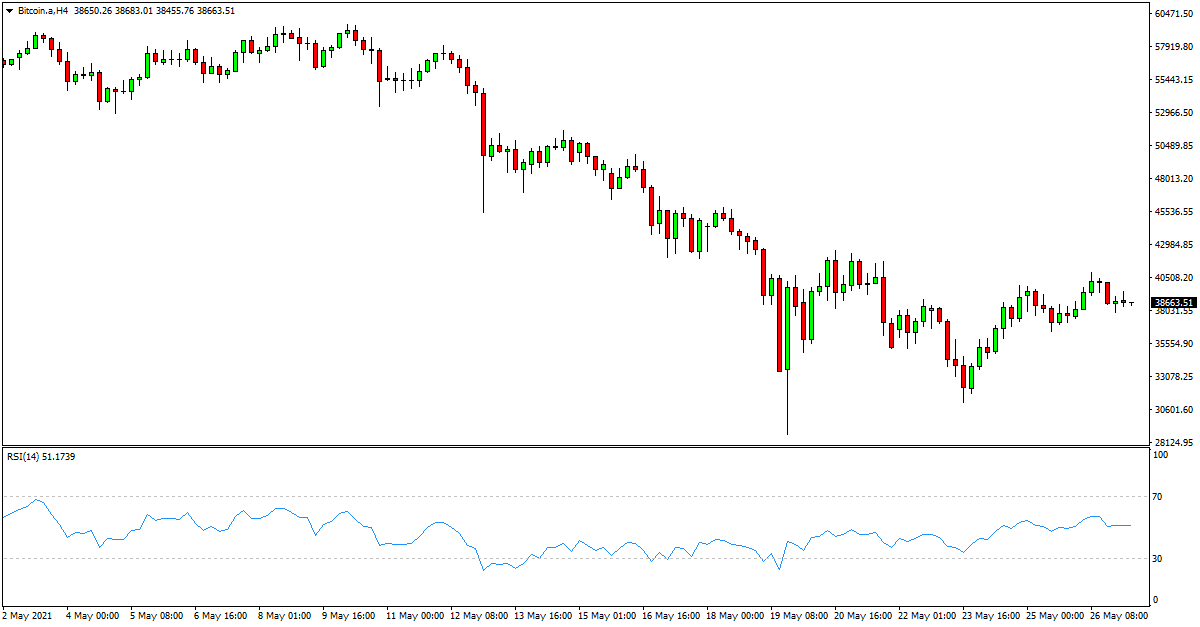
In markets that are trending, you’ll often see the RSI moving in a range of values and not displaying overbought/oversold conditions.
The chart below shows a downward trend in the price, while the RSI remains between 30 and 70 bands.

Buy and sell signals using the RSI indicator
It is possible to use the relative strength indicator for buy and sale signals.
To confirm a possible trade, combine the RSI indicator with other techniques of technical analysis.
The RSI can be used to measure key market levels. These can be levels of support and resistance or other areas that are important.
In the example below the price is moving towards a major resistance level. This is an important level that we can watch for possible short-reversal trading. Looking at the RSI we can see that the price has moved above the 70 level, indicating overbought and a potential reversal to the lower levels.
We could use these two pieces to make a short-term trade and watch the price move lower away from the resistance.

You can add Japanese candles or other indicators to your RSI signals to confirm them.
Use of the Relative Strength Indicator on MT4 or MT5
The relative strength indicator is easy to use in MT4 or MT5. Once you add it, the oscillator will appear at the bottom of your charts.
Follow these instructions to add the RSI indicator to your Metatrader charts;
- Open your MT4/MT5 charts.
- The “Insert’ button will appear at the top right of your charts.
- Select “Indicators”, then select the Relative Strength Index.
- You can then customize the RSI to suit your needs.

![PipFinite Volume Critical [Indicator Reviews]](https://mq177.com/wp-content/uploads/2023/05/5374034a40c8d6800cb4f449c2ea00a0-6.jpg)
![Smart Market Structure Concepts MT4 [Reviews]](https://mq177.com/wp-content/uploads/2023/06/smart-market-structure-concepts-mt4-screen-8146-1024x504.png)
terbinafine dosage treatment analysis
terbinafine dosage treatment analysis
terbinafine mechanism science
terbinafine mechanism science
toradol for migraine symptoms
toradol for migraine symptoms
minoxidil foam vs liquid detailed overview
minoxidil foam vs liquid detailed overview
minoxidil duration timeline
minoxidil duration timeline