One of the most useful techniques for analyzing technical data is a Fibonacci retracement. If you’re unfamiliar with Fibonacci retracement, don’t worry. It is basically the Fibonacci sequence, which comprises 1, 1, 2, 3, 5, 8, 13, and more. When you multiply the Fibonacci numbers by the next numbers, you’ll get what are known as the Fibonacci ratios. The Fibonacci Retracement software plots these ratios onto charts of prices. Essentially, you need to find the highs and lows before making the chart. The process of making the distinction between highs and lows before drawing the chart is an exhausting job. Naturally, you’re more likely to make errors, particularly if you aren’t familiar with the indicator. The good news is that we have an Automatic Fibonacci Retracement Indicator (MT4). Download it for free. Like the name suggests, the indicator shows up on charts automatically. It will determine the highs and lows of the charts automatically. This means that you don’t need to define the two points in advance.
The greatest benefit is that this auto-Fibonacci indicator can be utilized for all time frames and currency pairs.

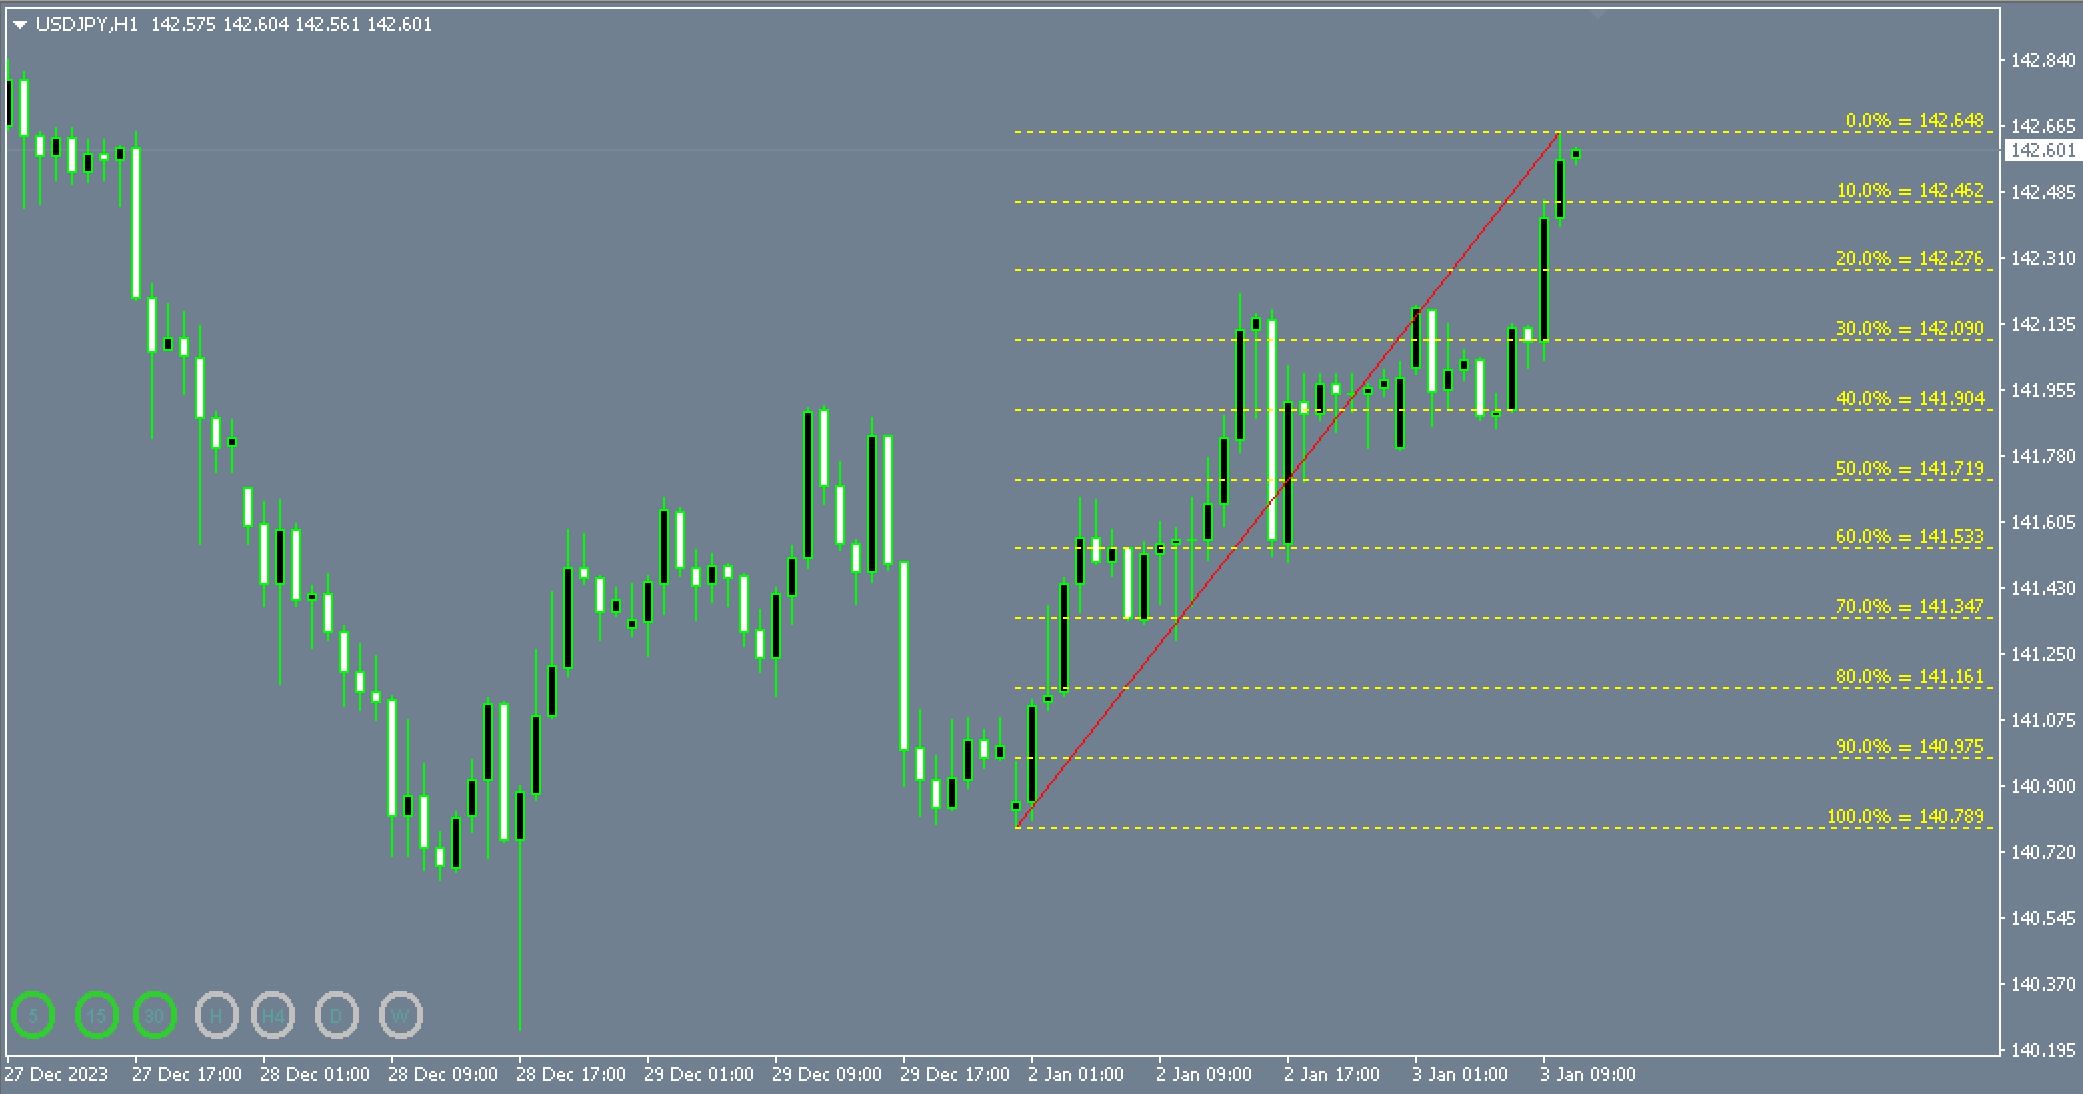
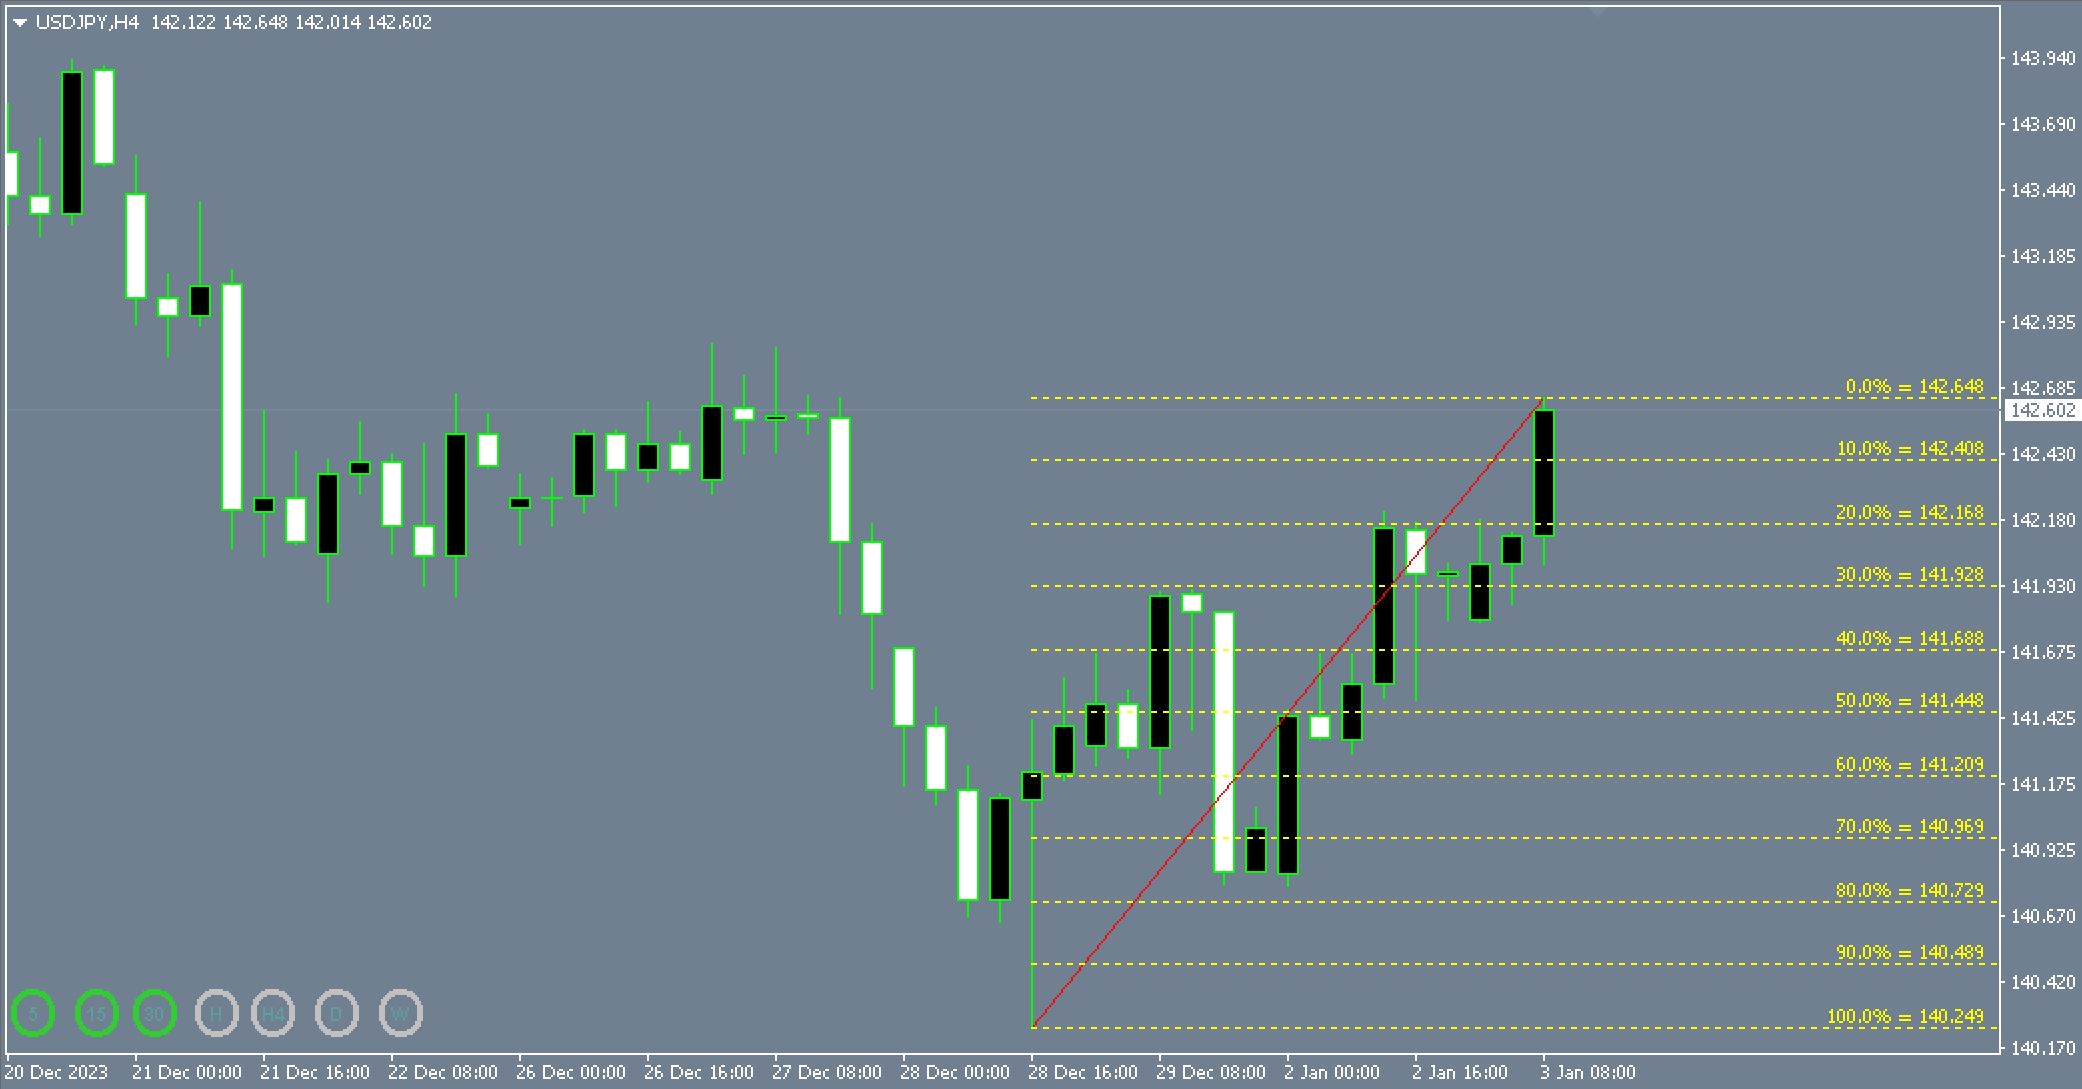
What is the auto-Fibonacci Retracement Indicator?
The auto-Fibonacci chart shows the retracement levels that lie between zero and 100%. In the event that the market turns into bearish mode, then the zero point will be at the highest, and 100 points will be at the bottom, and vice versa. In essence, once an all-time record high is reached, the market is likely to retrace its steps to the Fibonacci retracement levels.
Let’s suppose that an uptrend will reverse to the 38.2 percent Fibonacci level. You can simply keep an eye on the market until it begins to rebound to the market level of 38.2 percent and then put in a buy order. It is possible to place your stop loss just below the 50 percent Fibonacci level. In the case of exit strategies, you can put the take profit at the next resistance or high level.
In many instances, the price can move up to the 50% Fibonacci level. Yet, 61.8% is endeared to the majority of traders due to this huge pullback. The 78.6 percentage level also offers an excellent reversal zone, although it is not widely known.
In addition to trading pullbacks, Fibonacci levels are excellent levels of take-profit for those who are riding the trend. If, for instance, an uptrend is retracing, you can start the short position and take profit at the 68.1 percent threshold.
The price retracement of the currency pair extends past 38.2 percent and 50 percent levels. But once it reaches the 61.8 percent mark, the price retraces to the 38.6% mark before resuming the bullish momentum.
Based on the analysis you have made for your trade, you can begin an uptrend by placing a stop loss that is higher than the recent swing high. The best exit places are 78.6 percent or 100 percent Fibonacci levels that coincide with your next resistance zone. Some traders also utilize Fibonacci expansion to make profits.
Conclusion
The auto-Fibonacci retracement indicator allows traders to plot Fibonacci levels quickly. It does not give the exit and entry signals by themselves. However, the Fibonacci levels offer excellent exit and entry points. Therefore, it is recommended to employ this indicator in conjunction with other tools in order to create confluence.