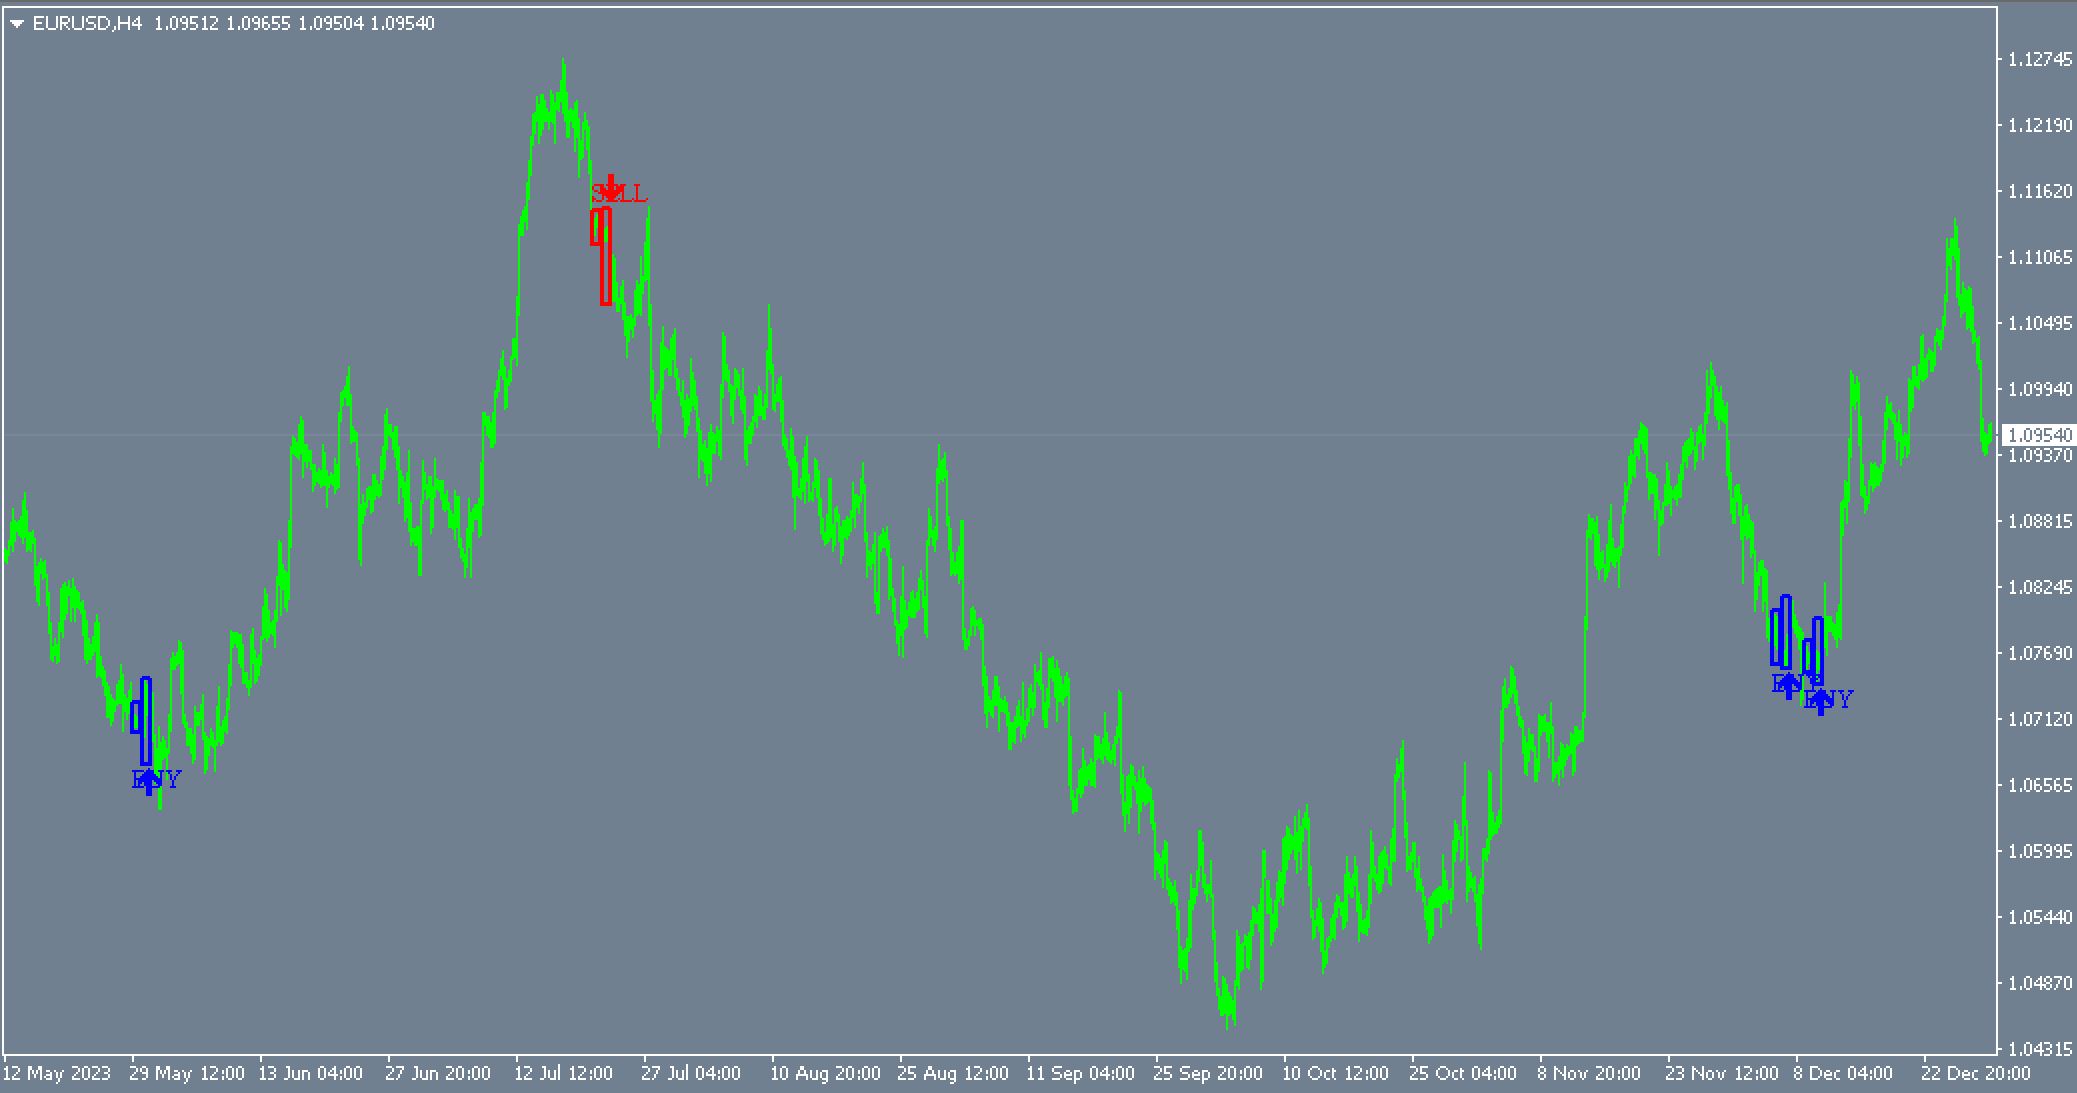
William Gann, a legend trader of the 20th Century, created his own grid that has become a classic for forex. Grid was used to divide the price chart into a series of bullish or bearish impulses. This automatic splitting is done by the Pama Ganngrid Indicator MT4. This is what you’ll see when the indicator is added to the price chart for MT4:
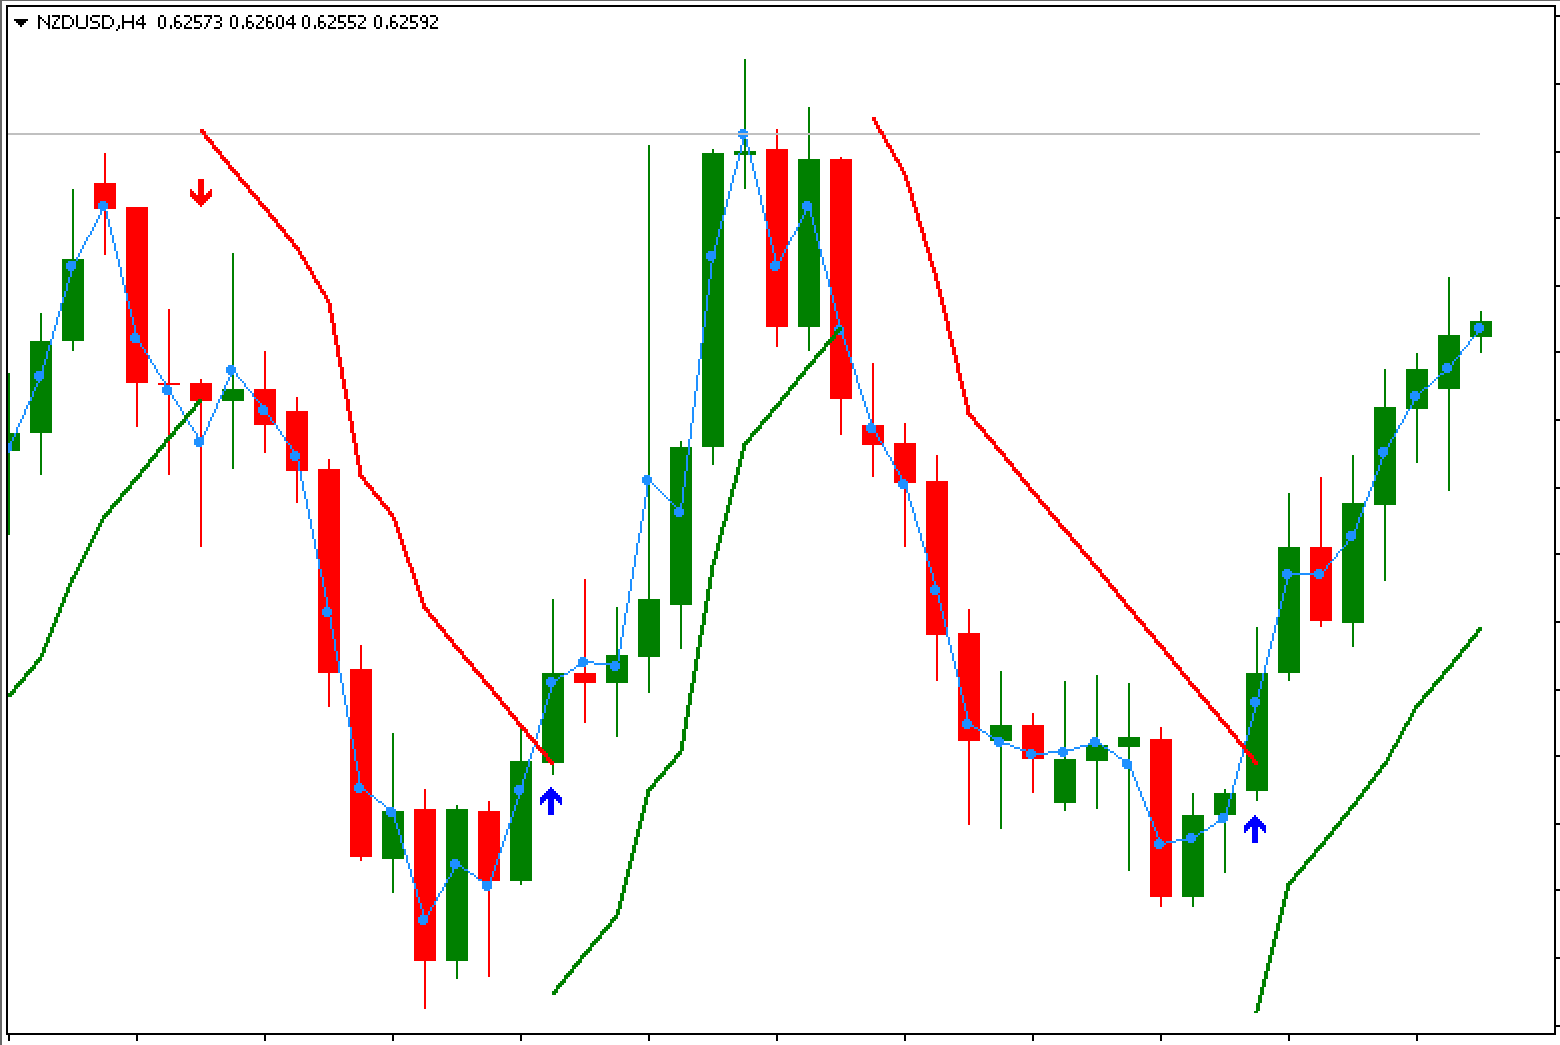
- The typical price is shown as the blue line above the price bars. It is calculated by: (high + low+ close) divided with three.
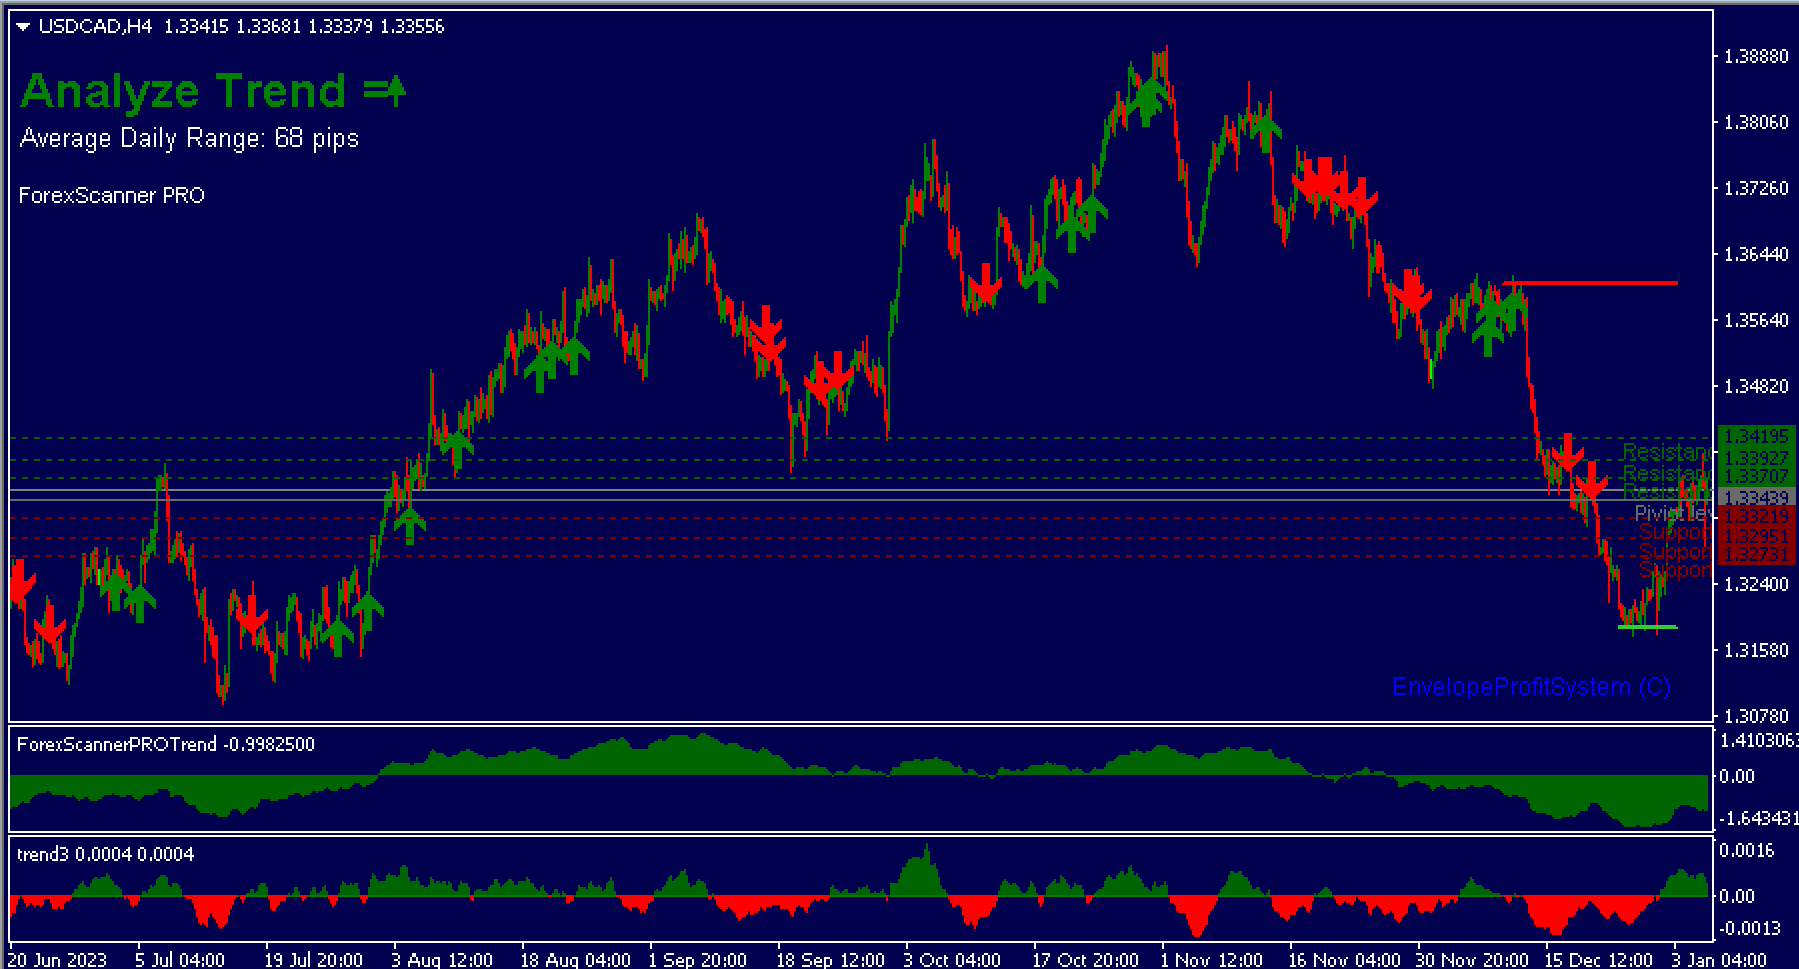
- Automatically, the levels of support and resistance are created.
- The trendlines for the short-term are red and green sloping lines.
How to trade with the Pama Ganngrid indicator
It is easy to see the principle:
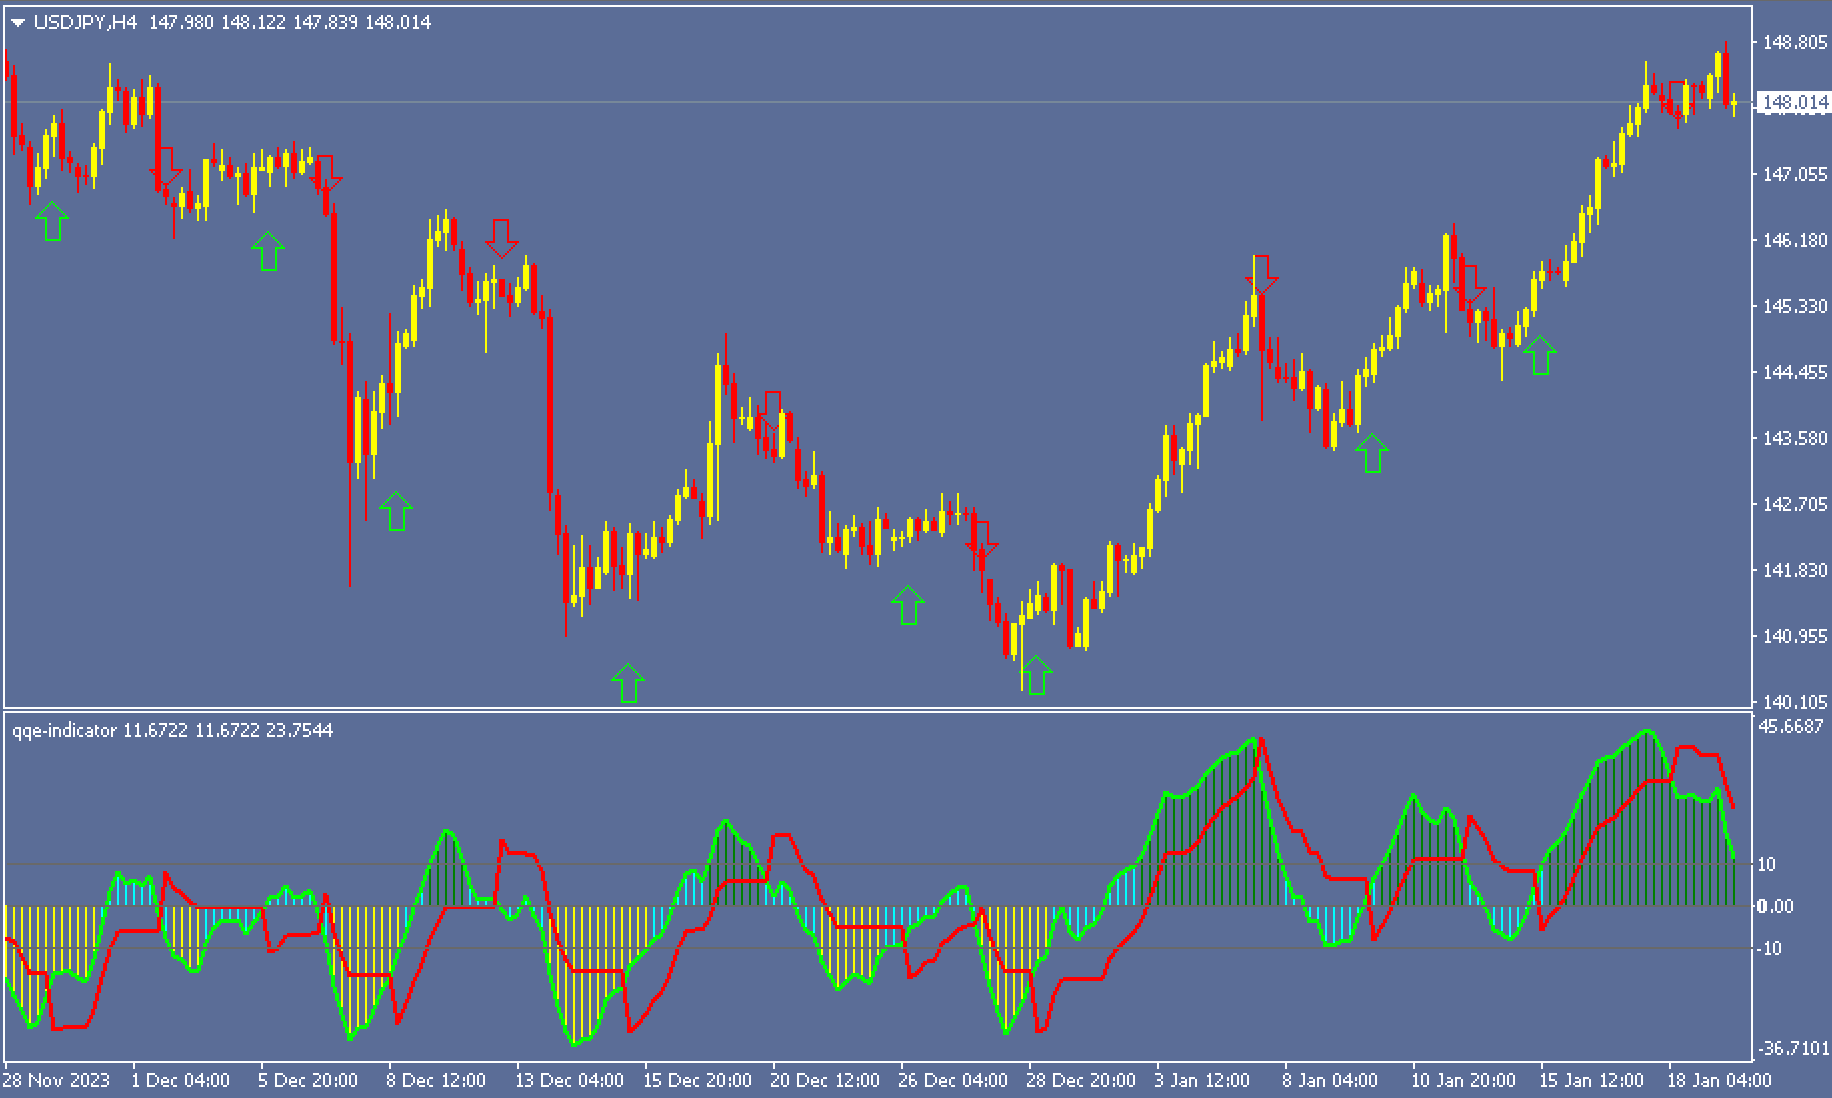
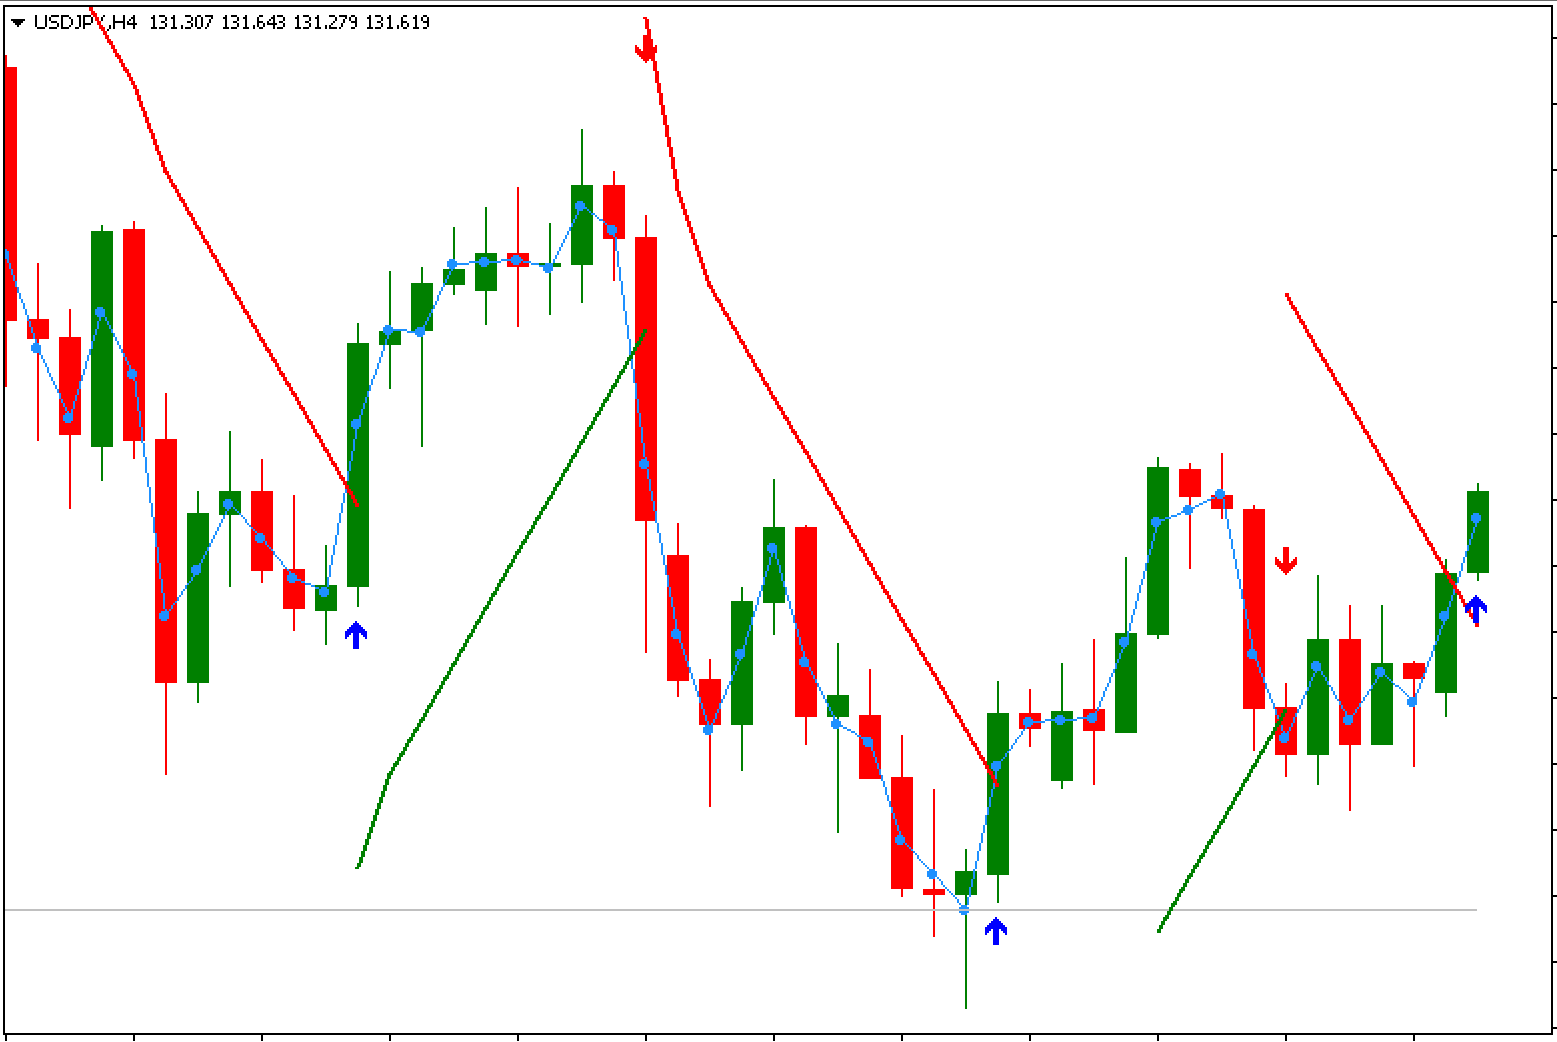
- The bullish trend ends when the blue line crosses over the green line from the top to the bottom. The indicator will draw a red arrow and give an automatic sell signal.
- Vice versa. The bearish trend ends when the blue line crosses over the red line, from the bottom up. This is when the indicator draws the green arrow and signals to enter the long position.
If you sell near the resistance line, your chances of making profit will increase.
These examples will provide more information on trading with the Pama Ganngrid Indicator.
Conclusion
Metatrader 4’s Pama Ganngrid indicator allows you to trade with the trend using the classic grid by William Gann.
The indicator automatically creates the grid (it is hidden default), and shows arrows on a price chart to give buy and sell signals.
The Pama Ganngrid indicator has many advantages:
- Pama Ganngrid’s simple signals make it the best indicator for beginners traders.
- Allows trading in forex, crypto, and equities, as well as other markets.
- Does not repaint
- The ability to improve the efficiency of signals by considering support and resistance levels can be achieved.
- Investors can use this information to view daily and weekly price charts.