PipFinite Volume Critical [Indicator Reviews]
![PipFinite Volume Critical [Indicator Reviews]](https://mq177.com/wp-content/uploads/2023/05/5374034a40c8d6800cb4f449c2ea00a0-6.jpg)
It is not meant to imply that the PVC is an unique tool with no comparable tools. I will describe below how you can replace the tool with similar free indicators.
Benefits and disadvantages
The following are the benefits of PVC:
- This tool can easily be combined with other algorithms, and included in any TS that requires information on market volume.
- All trading styles are suitable. PVC is suitable for all trading styles.
- The instrument doesn’t change its signal, which is always a plus.
- The bars on the histogram are drawn after the candlesticks on the chart have closed. If the signal is already visible, you can be certain that it won’t disappear once the candle closes.
One of the disadvantages is the high resource consumption. PVC can slow down the terminal, particularly if it is an old computer with less than 2GB of RAM or a weak processor. To reduce “bugs”, you can decrease the value of “Maximum_History_Bars”. This will reduce the amount of information that is loaded into the terminal memory.
The tool costs $ 98. You will need to buy all five licenses if you cannot find a partner trader with whom you are willing to share the payment. There is an alternative – you can pay $66 per month as rent.
What signals does this tool give?
PVC’s main job is to measure the market volume in order to identify the major trends in the market. The indicator analyses where the biggest volumes are coming in and then makes forecasts based on these data.
PVC is one of many indicators that Pipfinite offers. You can use it to determine if the current market situation is flat or trending. Volume increases and decreases can be used to predict where the prices will go in the future.
PVC, of course, is not the Holy Grail. You can use it when you trade using the VSA method, in combination with patterns, level or other technical indicators. You should not rely solely on the signals. It can sometimes be wrong, just like any other tool.
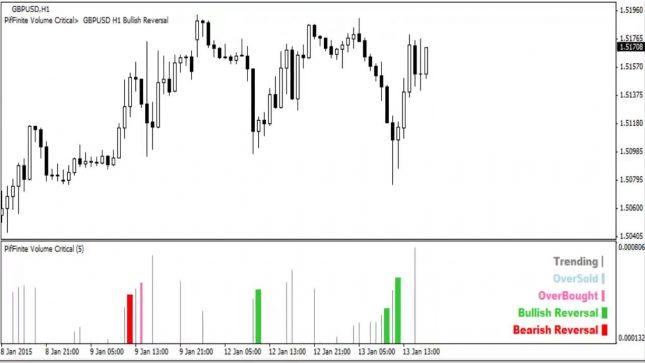
The interface was designed to be as simple and intuitive as possible. The PVC appears below the chart, and is a vertical bar histogram. The bars from each group have a different color. You can tell by the color what’s happening in the market and the current trend.
PipFinite volume critical There are six groups of bars:
- The gray. Flat. You will see bars like this on the histogram if there isn’t a strong trend. It is not necessary to trade during such times. Wait and see, because after every flat there will be a “market awakening”.
- Yellow. These bars are usually found following the gray bars. These bars indicate an increase in volatility and volume of transactions. It is still unclear which way the trend will go. You should not trade until you have noticed the yellow bars.
- A bar of this color appears on the histogram to indicate the start of a bullish movement. The stronger the impulse, the longer this column is. You can move into a long position when a pink bar appears.
- Blue. This bar will signal the start of a downward trend. The bigger the ball the greater the fall in price. You can short a position when the blue column appears.
- Red. They indicate an extreme overbought condition. The market is flooded with orders to buy and the price of the asset cannot rise any further. The trend starts to reverse and the price begins to fall. You should close all Buy orders if you notice this signal.
- Green. Indicates that the asset has been sold at a very high price. This bar shows that there are too many Sell orders on the market and the price is at its lowest. The downward trend changes into an upward trend. The green bar signals to close all Sell orders currently active and open a Buy deal.
The pink and blue bars show a simple market that is oversold or overbought. Red and green bars show extreme oversold/overbought situations. Yellow and gray are not direct signals, and they cannot be used to open a trade. You can choose to include all the bars in your histogram or only those you intend to trade, such as red and green.
We recommend adding the Currency Slope strength indicator on the chart to connect with the PVC. It displays the strength of currencies within a currency pair.
Not every novice trader will want to immediately purchase the paid version of PVC. If you tested the program in demo mode and did not decide to purchase it, you can use a free analogue – the Volume indicator. This tool is already built into the MT4 terminal.
For comparison, we added both instruments to the chart to see what happened. Take a look at the screenshot below. It shows that the indicators give approximately the same signals. If the volumes increase and reach a peak, then both PVC and Volume react to this.
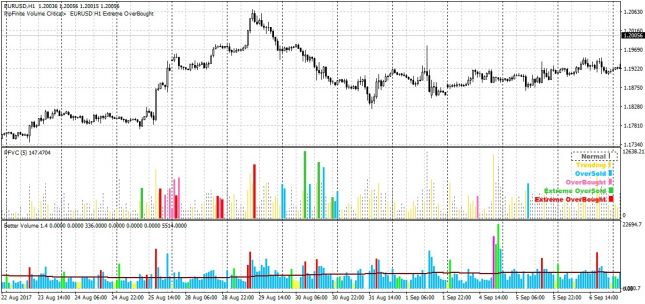
The only difference, perhaps, is that PVC is more sensitive and picks up almost all market fluctuations. By the colors of its bars, you can quickly determine the presence of a trend or flat.
In all other respects, the tools are similar. Volume also does not lag behind the price and works without redrawing. Plus, it’s completely free.
The PVC and Volume indicators can be replaced with an oscillator that can also show oversold and overbought zones. Such instruments have a completely different calculation algorithm, but they can also be used to determine if the price is in a critical zone, after which a trend change usually begins.
- PVC in bundles with other indicators
The Pipfinite volume critical indicator is best used in conjunction with other tools. The indicator can be used with any algorithm, but these are the most common:
- PVC + Support / Resistance Levels or Pivot Levels. You should be ready for a breakout or a chart reversal when the price is approaching the key level. The PVC indicator confirms the reversal signals from the levels. When the PVC shows a green bar or a blue bar when the price is approaching the support line, this is a signal to buy. When the PVC shows a red bar or a pink bar when the price is approaching the resistance line, this is a buy signal.
- Stochastic, or another oscillator. + Here’s everything simple – If the oscillator shows the market as overbought and oversold at the same time, the reversal signals are strengthened. If the stochastic zone is overbought and a red bar appears then it is a confirmation that a buy is needed. If the PVC shows a green bar then the oscillator also needs to be in the oversold area for the Buy signal.
- PVC+Macd. The histogram will confirm the signal in this case. If the histogram Macd is above zero then this is a confirmation for a Buy Signal.
- The Price Action is Simple – If a reversal patterns appears on the chart you should confirm its signal with Pipfinite volume critical. If you don’t see any confirmation of the pattern, it could be a trap that big players set to get the price they want by using stops.
- Bollinger Bands + Pipfinite VC. PVC works well when combined with channel indicators. Trading is analogous to levels. If the price touches the support line (lower BB band), we will confirm a buy, and if it touches the resistance line (upper Bollinger band), a sell.
- Fibonacci levels + A very useful and interesting link. Fibonacci levels can be used for trend corrections and pullbacks. PVC volume can be used to predict how the price will act when it approaches the level. If the chart shows a correction of a downward trend, but the indicator is showing a green or blue bar, it’s likely that the rollback in the downtrend will continue. A complete change in trend may be possible. The PVC will show a red bar if the price has rolled back to the correction level from the downward trend. This is an indication that the rollback is over and the bearish trends will continue.
![Smart Market Structure Concepts MT4 [Reviews]](https://mq177.com/wp-content/uploads/2023/06/smart-market-structure-concepts-mt4-screen-8146-1024x504.png)
Responses