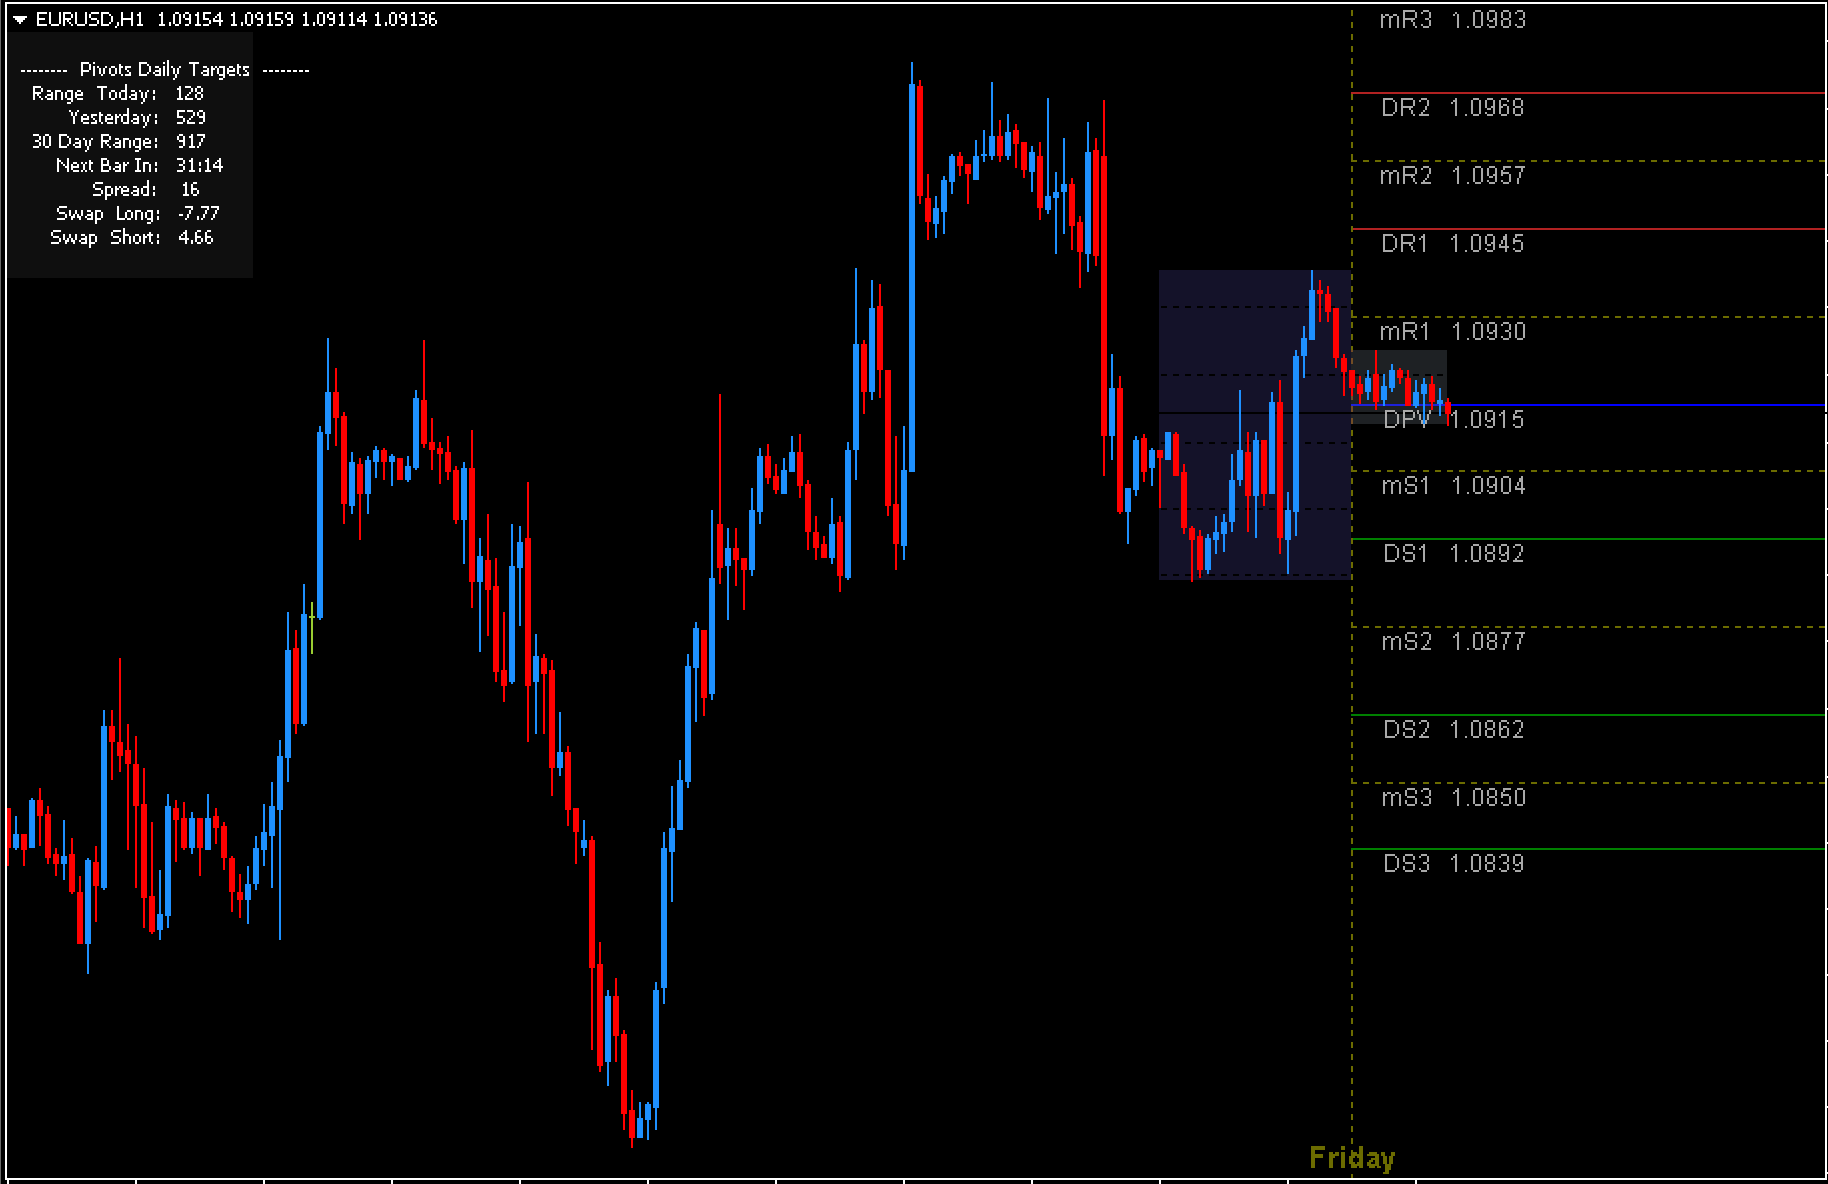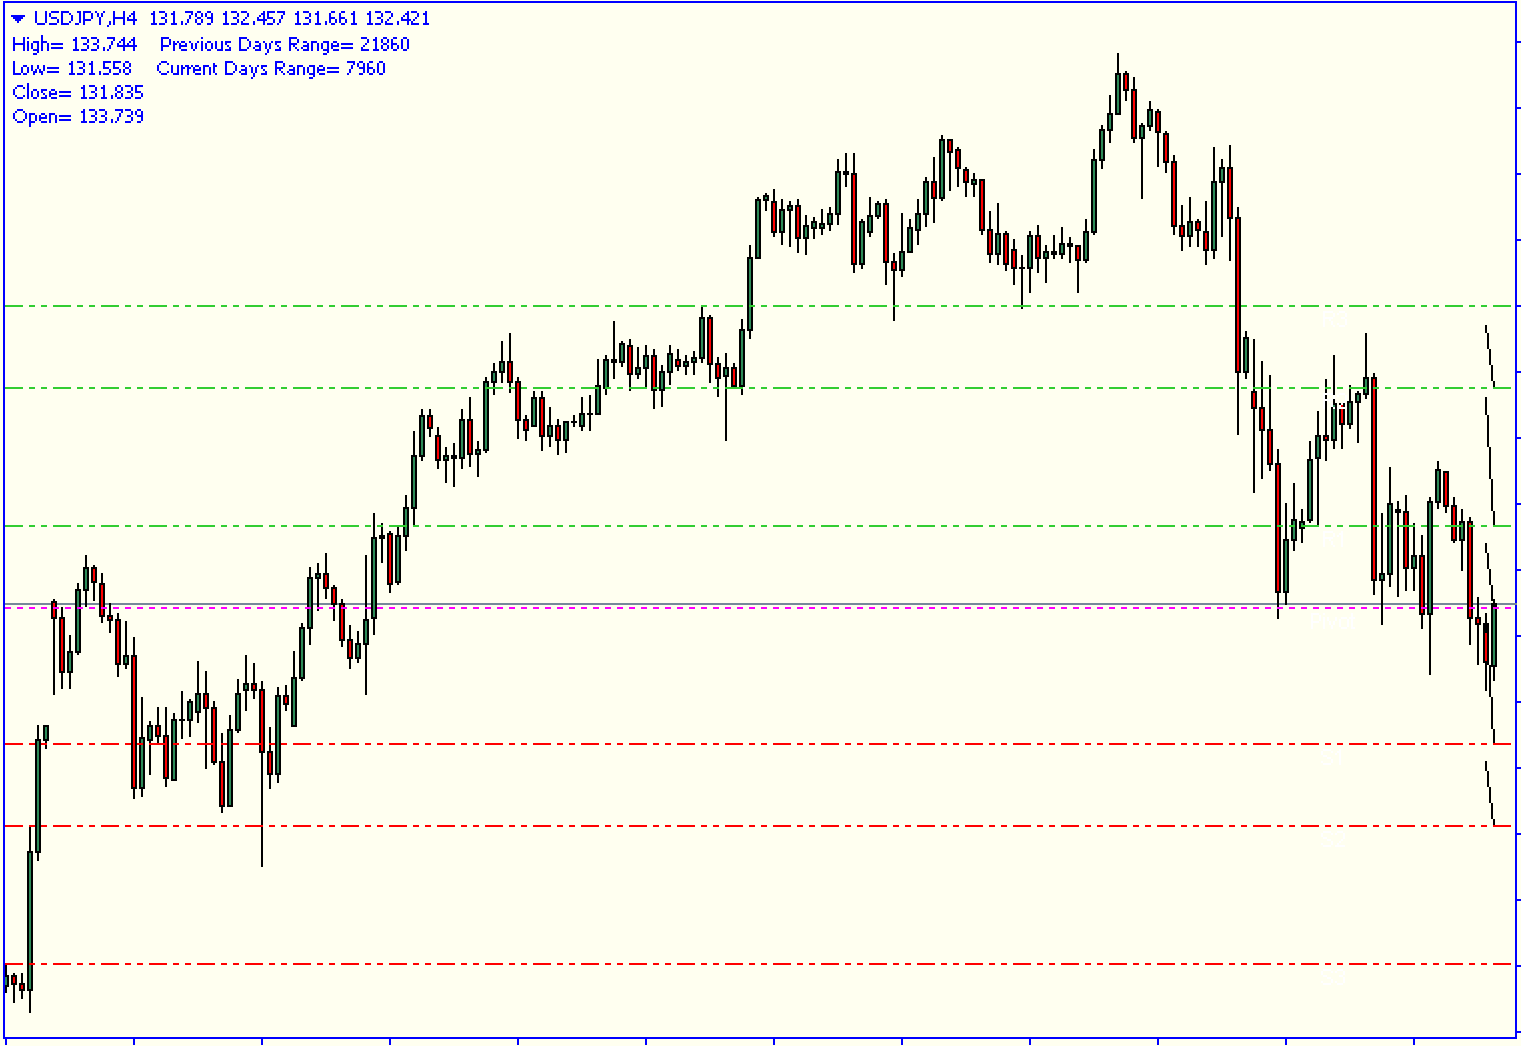
MT4’s daily support/resistance special indicator plots support/resistance based on the previous day’s open, high, low and close prices. Forex traders can then identify the most supportive and weakest support areas and determine bullish or bearish market conditions. Technical forex traders can also use support and resistance to implement breakout trading strategies. Traders can also use a reversal trading strategy if the price of an item is rejected at a support or resistance line.
The indicator does not use daily price charts to plot support and resistance lines. All other intra-day time frames have the same support and resistance. The indicator is compatible with intraday trading on lower time frames.
The chart output is just a support and resistance line. This allows advanced and new Forex traders to recognize the same indicators and make appropriate buy or sell decisions. New traders need to have the ability to confirm and identify price reversals through price behavior. On the other hand, advanced forex traders can use the indicator as well as support and resistance lines and incorporate them into other trading strategies. They also have the option of trading with other technical indicators in confluence or together. Forex traders can also download the indicator for free and install it easily.
Special daily support and resistance indicators for MT4 trading setups
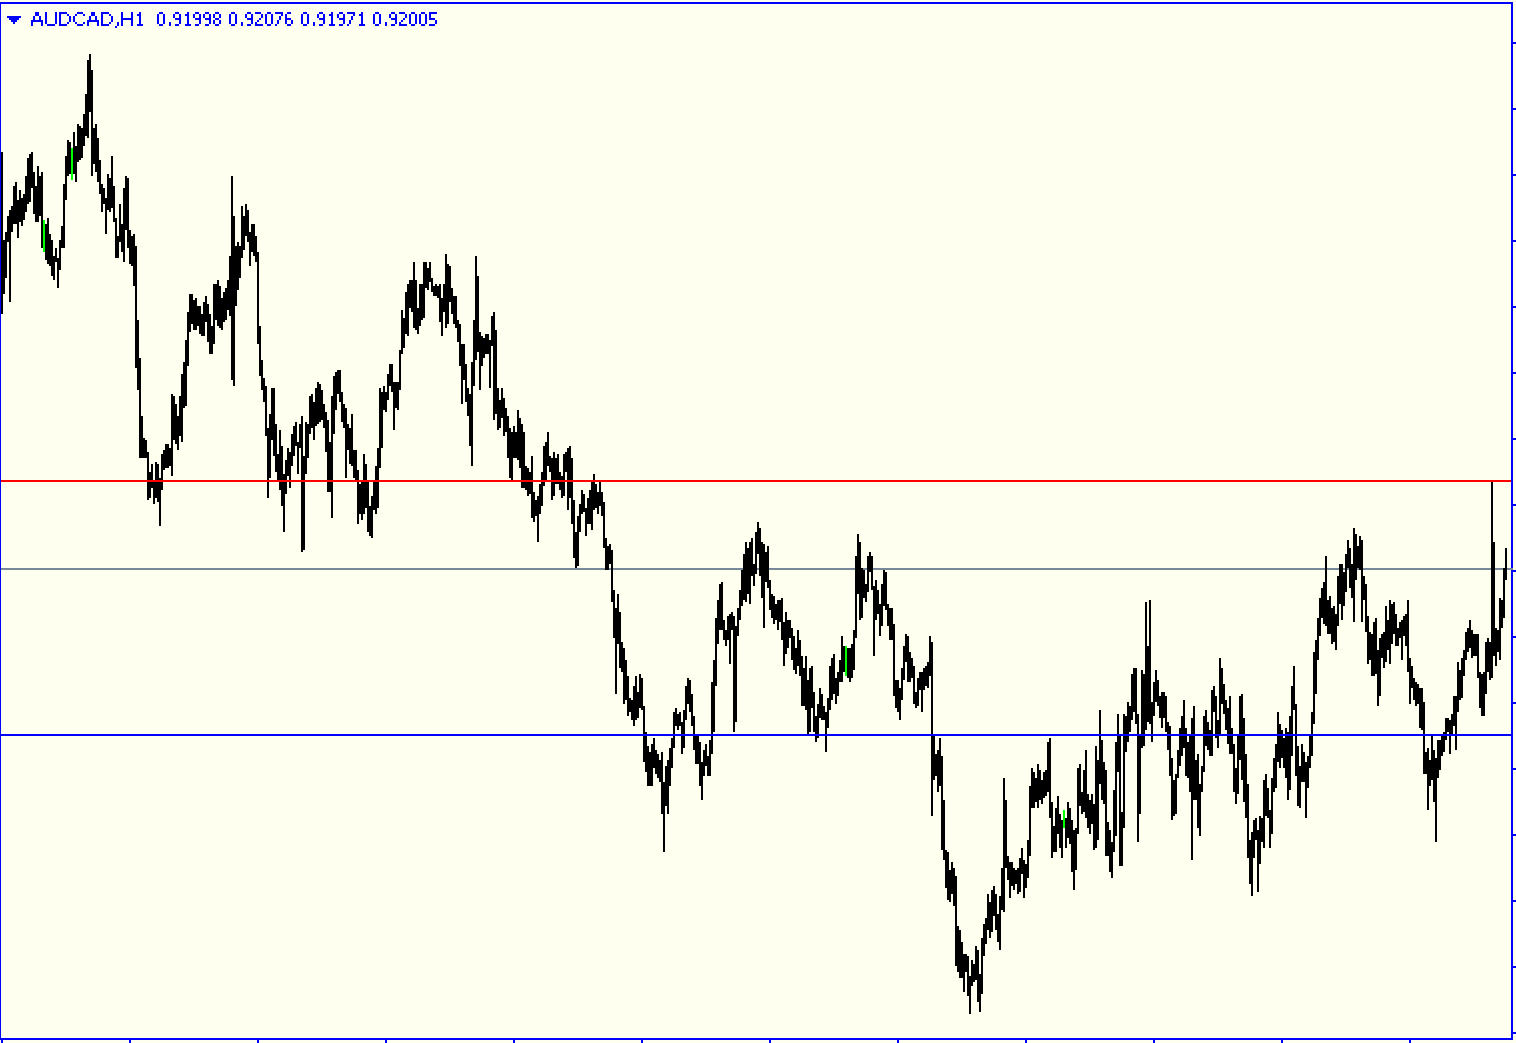
If the price rises above the resistance line, it indicates a bullish market. Forex traders can also place buy trades below the oscillator low and set a stop loss. This indicator does not provide a profit target, so traders should exit on market weakness, or at high risk-reward rates.
It is also a sign of a bearish trend if the price falls below this support line. Forex traders should establish a sell position and set a stop loss greater than the swing high. Profit booking is best done after the trade has reached a favorable risk-reward ratio.
Conclusion
MT4’s daily support/resistance special indicator simply acts as a support/resistance line, simplifying trading. However, traders must use price action and other technical indicators to confirm price reversals or continuation. This indicator is not the best trading tool. Placing limit orders at support or resistance lines should be avoided. Also, it is important to predict price reversals before placing a limit order.