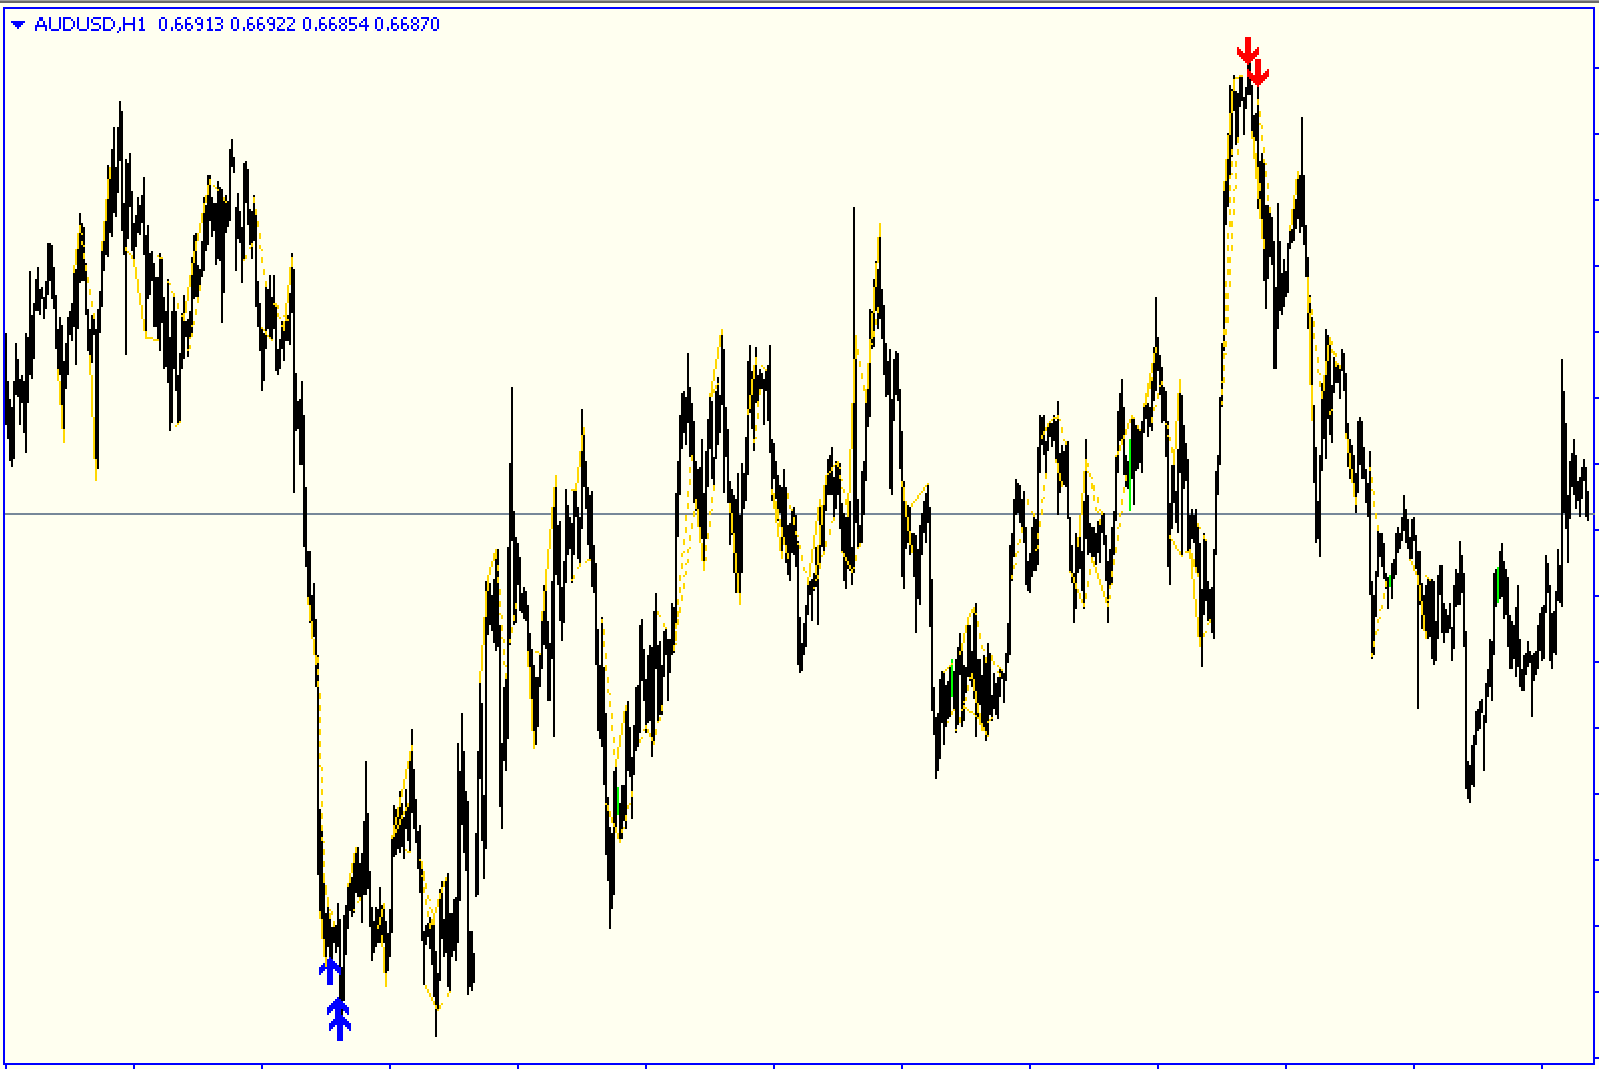
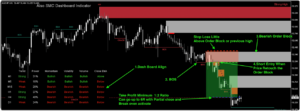
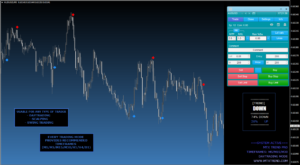
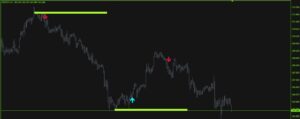
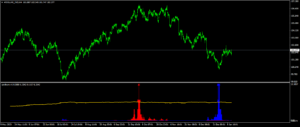
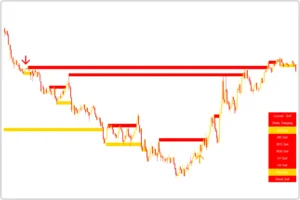
The TradeTime V2 indicator is a simple indicator for MT4 that shows which direction the trend is heading. The indicator plots a rectangular box on candlesticks according to time. Whatever time frame the trader selects, it will draw a box according to the time.
If there is a high trend, the indicator illustrates the box. Once the trend starts to diminish, it draws another box to indicate the conclusion to the current trend. This indicator is most effective when using higher timeframes, such as the weekly or daily charts.
TradeTime v2 Indicator BUY/SELL Signals
To identify the signals for buy and sell, traders must examine how the indicator draws boxes. Usually, the indicator plots boxes at the beginning or end of the current trend. In a trend that is up, the indicator plots the box in the bullish candle. traders may trade long.
The TradeTime V2 Indicator creates boxes on the bearish candle near the beginning of the current trend. This is where traders can go short. You may also combine this indicator with other indicators, such as those from RSI or MACD, to confirm the signal.
Conclusion
The TradeTime V2 Indicator is a MT4 indicator that uses time to determine how the trends are moving in relation to the beginning and ending of ours. You can also download the indicator at no cost through our site.


