Drawing trendlines is an essential skill in trading. This allows you to identify trading opportunities when the price changes in a channel. You can identify the areas where the price may reverse if you draw the lines properly. You don’t need to draw the channel yourself. The SHI Channel indicator does all the work for you. Run the indicator and the indicator will plot the channel on your chart.
How to trade using the Signal
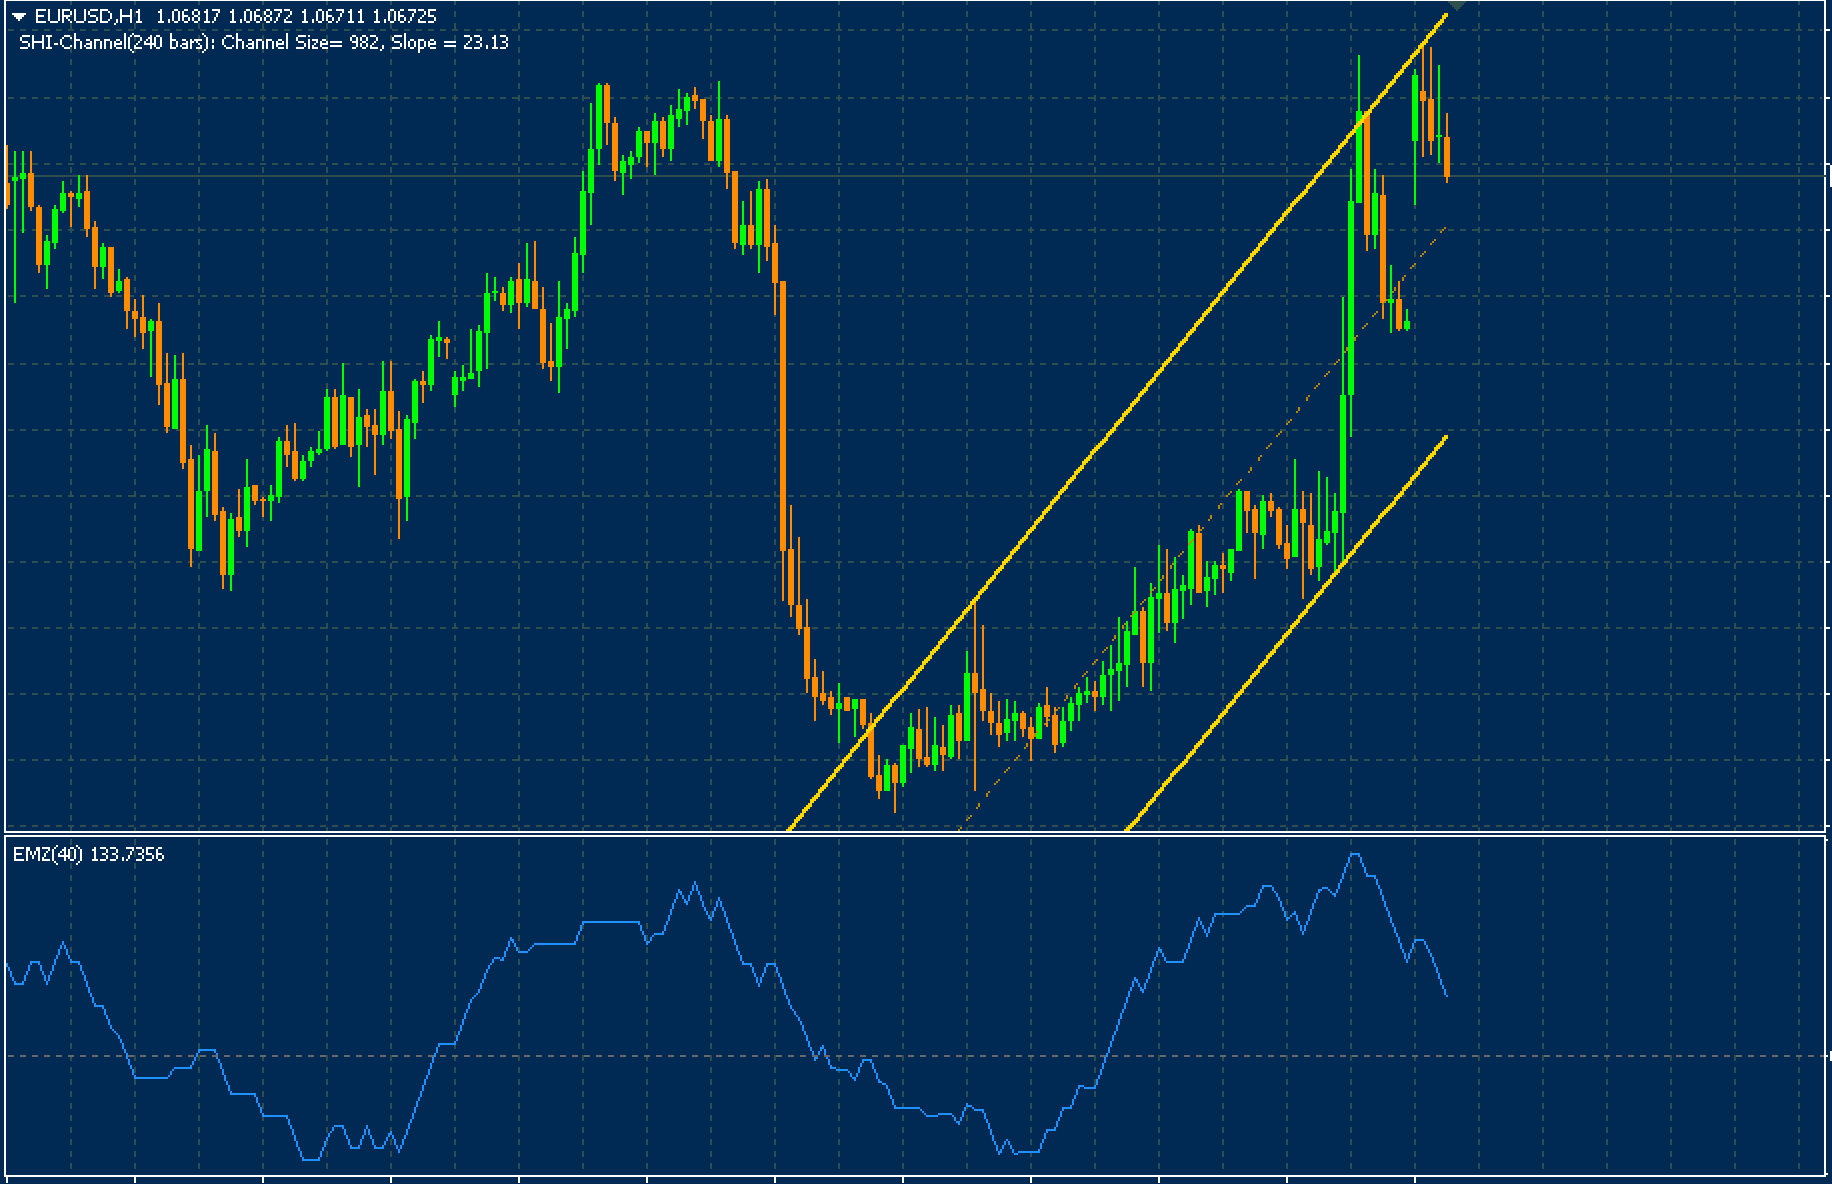
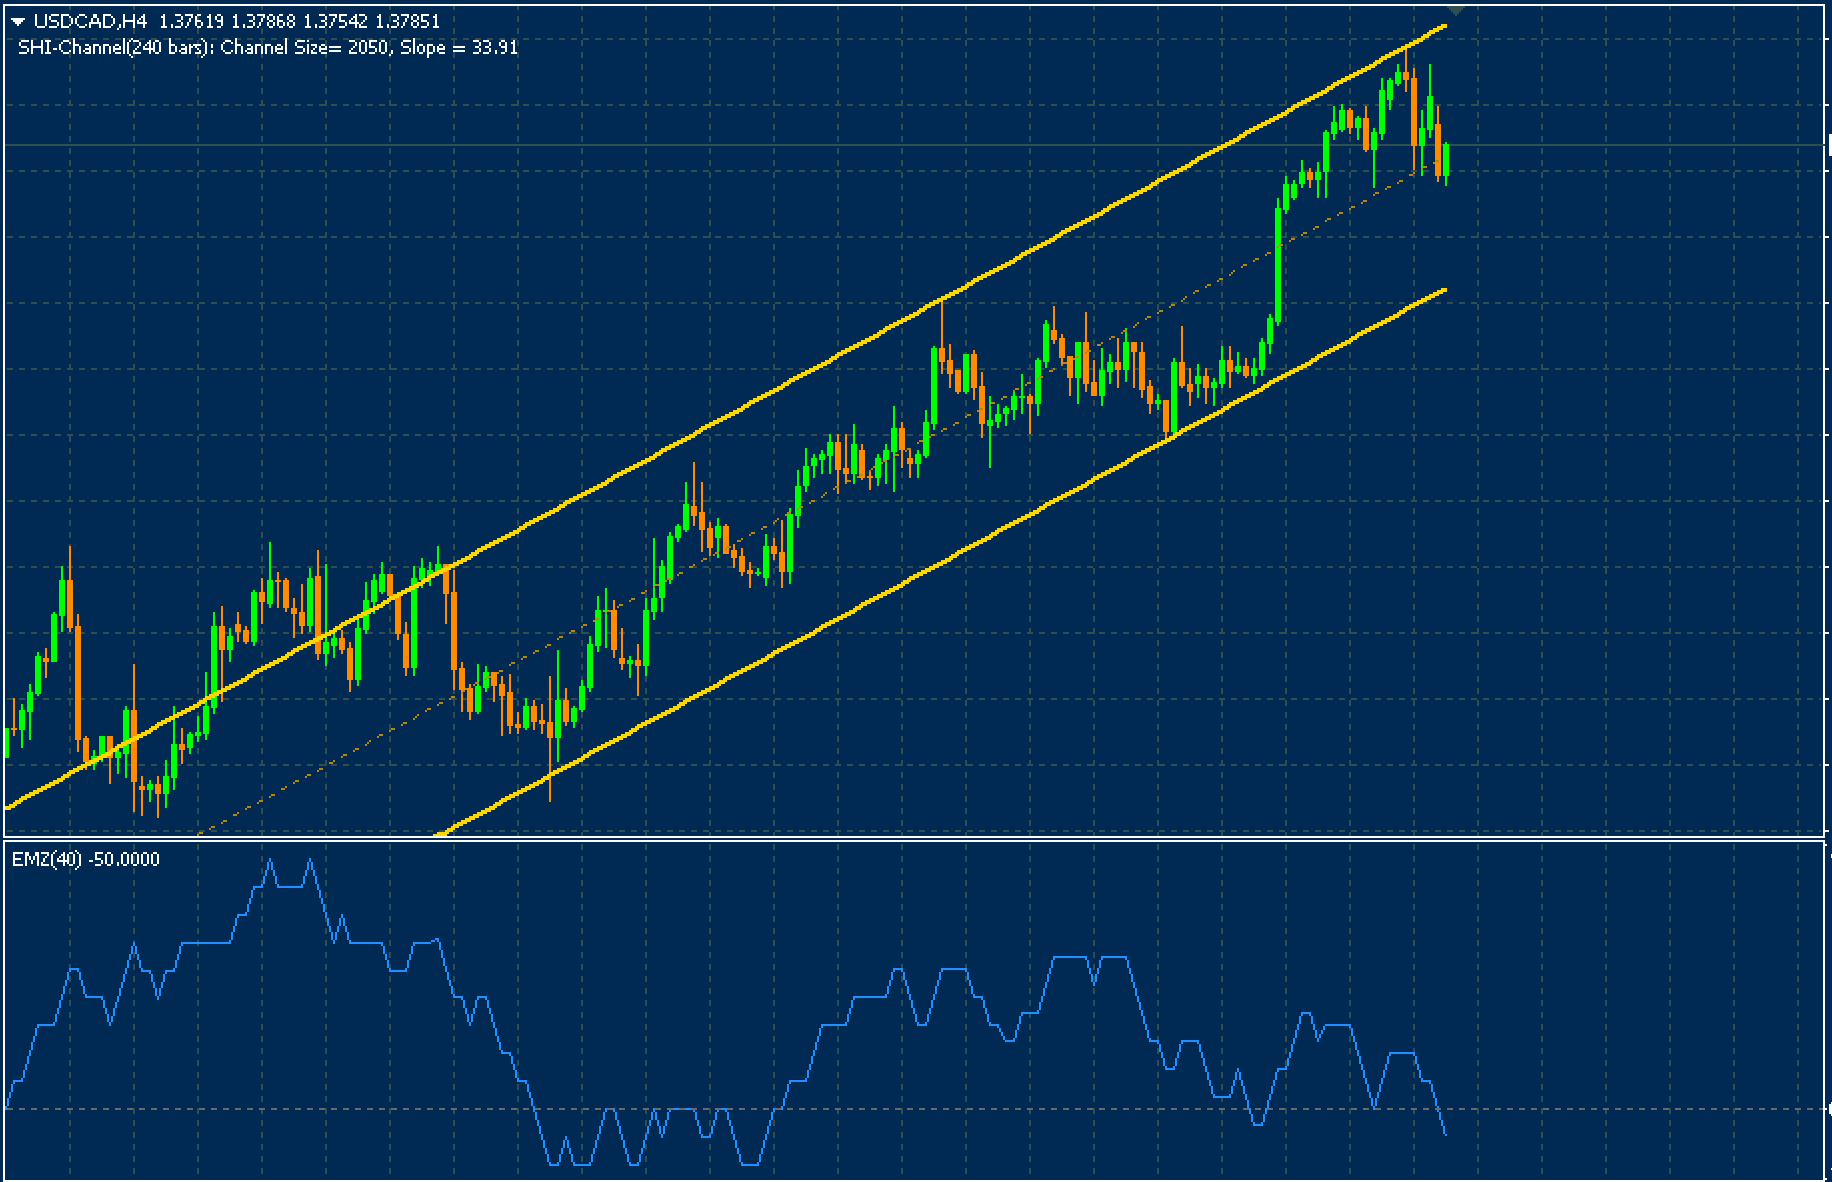
Three lines make up the SHI Channel. The support is provided by the lower line. The resistance lines are the upper and lower lines. The upper line connects the swing high and the lower lines connect to the swing low. The median line between the two lines is called the center line. You can open a buy or sell order as soon as the price reaches the support line. When the price reaches the resistance line, you can shorten the position.
SHI Channel Trading Example
You can see how the currency pair rebounded after hitting the channel lines. Wait for the currency pair’s support line to cross, then enter a long trade, and then sell when it crosses the resistance line. The channel’s price range is more than 200 pips.
How the Channel Indicator Works
The channel indicator plots the following main lines:
- Upper Channel Line – Connects swing highs to mark resistance
- Lower Channel Line – Connects swing lows to mark support
- Midline – Plots a line in the middle of the channel
The upper and lower lines contain all price activity within the channel boundaries. The midpoint represents the average price level.
As new swing points form, the channel adjusts and extends forward. Traders look to buy near the lower channel and sell near the upper channel when using this indicator.
Trading Signals
The main trading signals provided by the channel indicator are:
Long Entries
- Price testing lower channel support
- Bounces off lower channel line
- Breakouts above channel resistance
Short Entries
- Price testing upper channel resistance
- Rejection off upper channel line
- Breakdowns below channel support
Exits
- Price reaching opposite channel boundary
- Closing beyond channel support or resistance
- Moving average crossovers
Strategies to Trade Channel Indicator
Here are some effective strategies to trade using the channel indicator:
Range Trading
Buy near support and sell near resistance when channel direction is unclear. Book profits at channel highs/lows.
Breakouts
Trade breakouts with momentum in the direction of a break when the price closes outside the channel. Ride extended trends.
Pullbacks
Enter pullbacks off moving averages when the price reaches the midpoint after testing a boundary.
Trend Following
If the channel is sloping, trade in the trend direction. Buy pullbacks in uptrend channels and short bounces in downtrends.
Optimizing the Indicator
Traders can refine the channel indicator based on market conditions:
Timeframe
Higher timeframes like 4H, daily for more reliable channels. Lower timeframes like 15M for scalping.
Channel Type
Use Standard, Linear Regression, and Moving Average type channels. Test to find the best fit.
Number of bars
Channels based on 20+ bars are considered more stable and predictive.
Upper/Lower Offset
Increase/decrease distance between midpoint and channels to widen or narrow ranges.
Benefits of the Channel Indicator
Key advantages of using the channel indicator in trading:
- Clearly visualizes support and resistance boundaries
- Quantifies when price is overextended for reversals
- Helps determine when trends are likely to continue or reverse
- Spots consolidations and ranging price action
- Guides optimal entry and exit timing
- Versatile for use in range and trend strategies
- This can be applied to charts of any timeframe or asset
- Simplifies analysis compared to manual channel drawing
Risk Management with Channel Indicator
Here are some guidelines for managing risk when trading channels:
- Place stop loss below channel support in longs, above resistance in shorts
- Move stop to breakeven once the price reaches the midpoint
- Trail stop under lowest channel line in uptrends, above highest line in downtrends
- Take partial profits near boundaries and let the rest run
- Avoid overtrading – focus on high-probability setups
- Incorporate volatility in position sizing and stop distance
- Use larger stops and smaller position sizes in choppy markets
Conclusion
The channel indicator is a valuable addition to the trader’s toolkit thanks to its ability to highlight support and resistance levels where the probability of bounces is high. By optimizing its parameters and combining them with other indicators to confirm signals, traders can achieve consistent success trading within channels. However, maintaining sound risk management protocols remains crucial to long-term profitability when channel trading.
Channel traders will find the Shi channels a valuable addition. This helps you to identify areas where price is likely to reverse within a particular trend. It can be used as a single strategy or combined with other indicators.
FAQs
Q: Does the channel indicator repaint?
A: No, the channel indicator plots live on the chart and do not repaint, so signals remain valid once triggered.
Q: What timeframe works best for the channel indicator?
A: It can be used in any timeframe from 1 minute to weekly. Higher timeframes tend to produce more reliable, stable channels.
Q: What instruments can the channel indicator be used for?
A: It works effectively on forex, stocks, commodities, crypto, and any liquid market with technical price action.
Q: Does a narrowing channel predict a breakout?
A: In general yes, though other indicators should confirm a narrowing range before anticipating breakouts.
Q: Can channels slope upwards or downwards?
A: Yes, channels can also slope reflecting the underlying trend, allowing additional trend trade strategies.