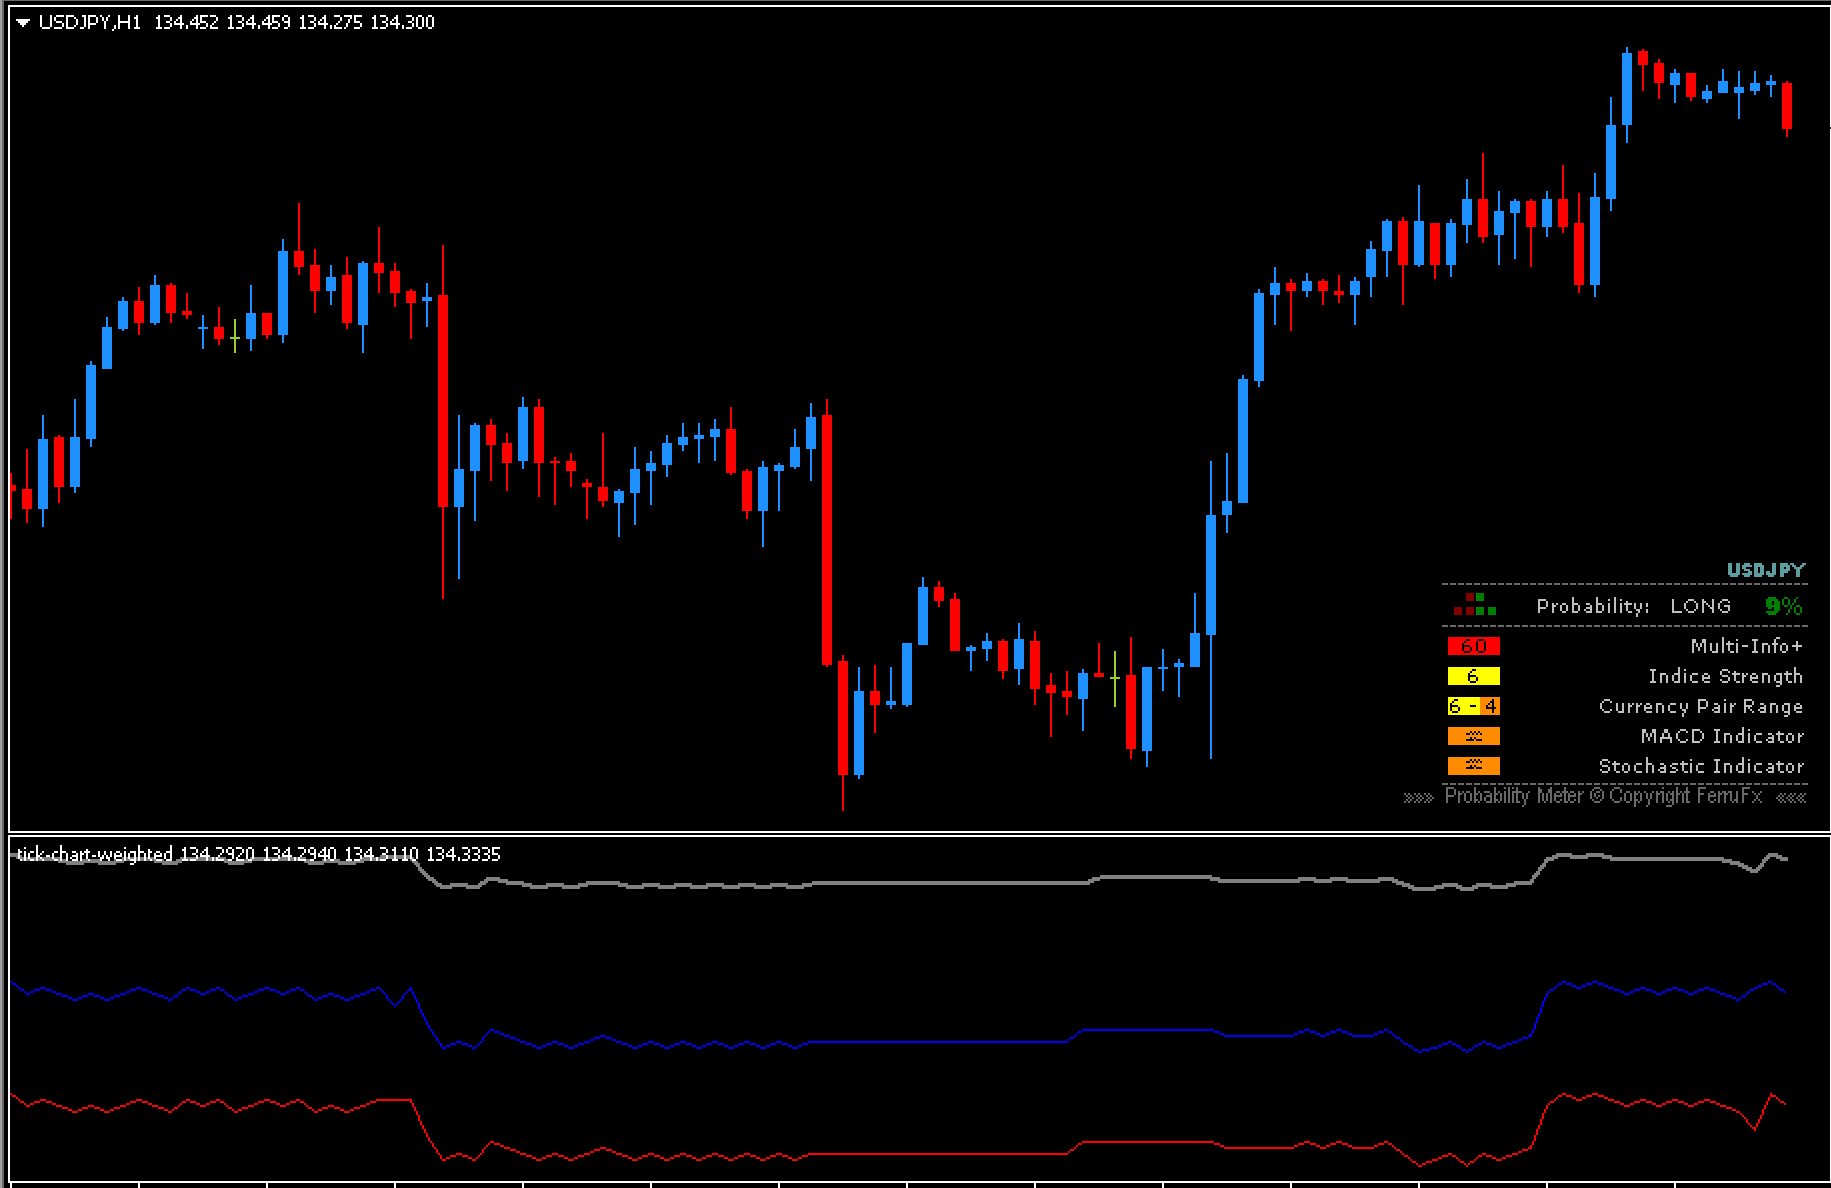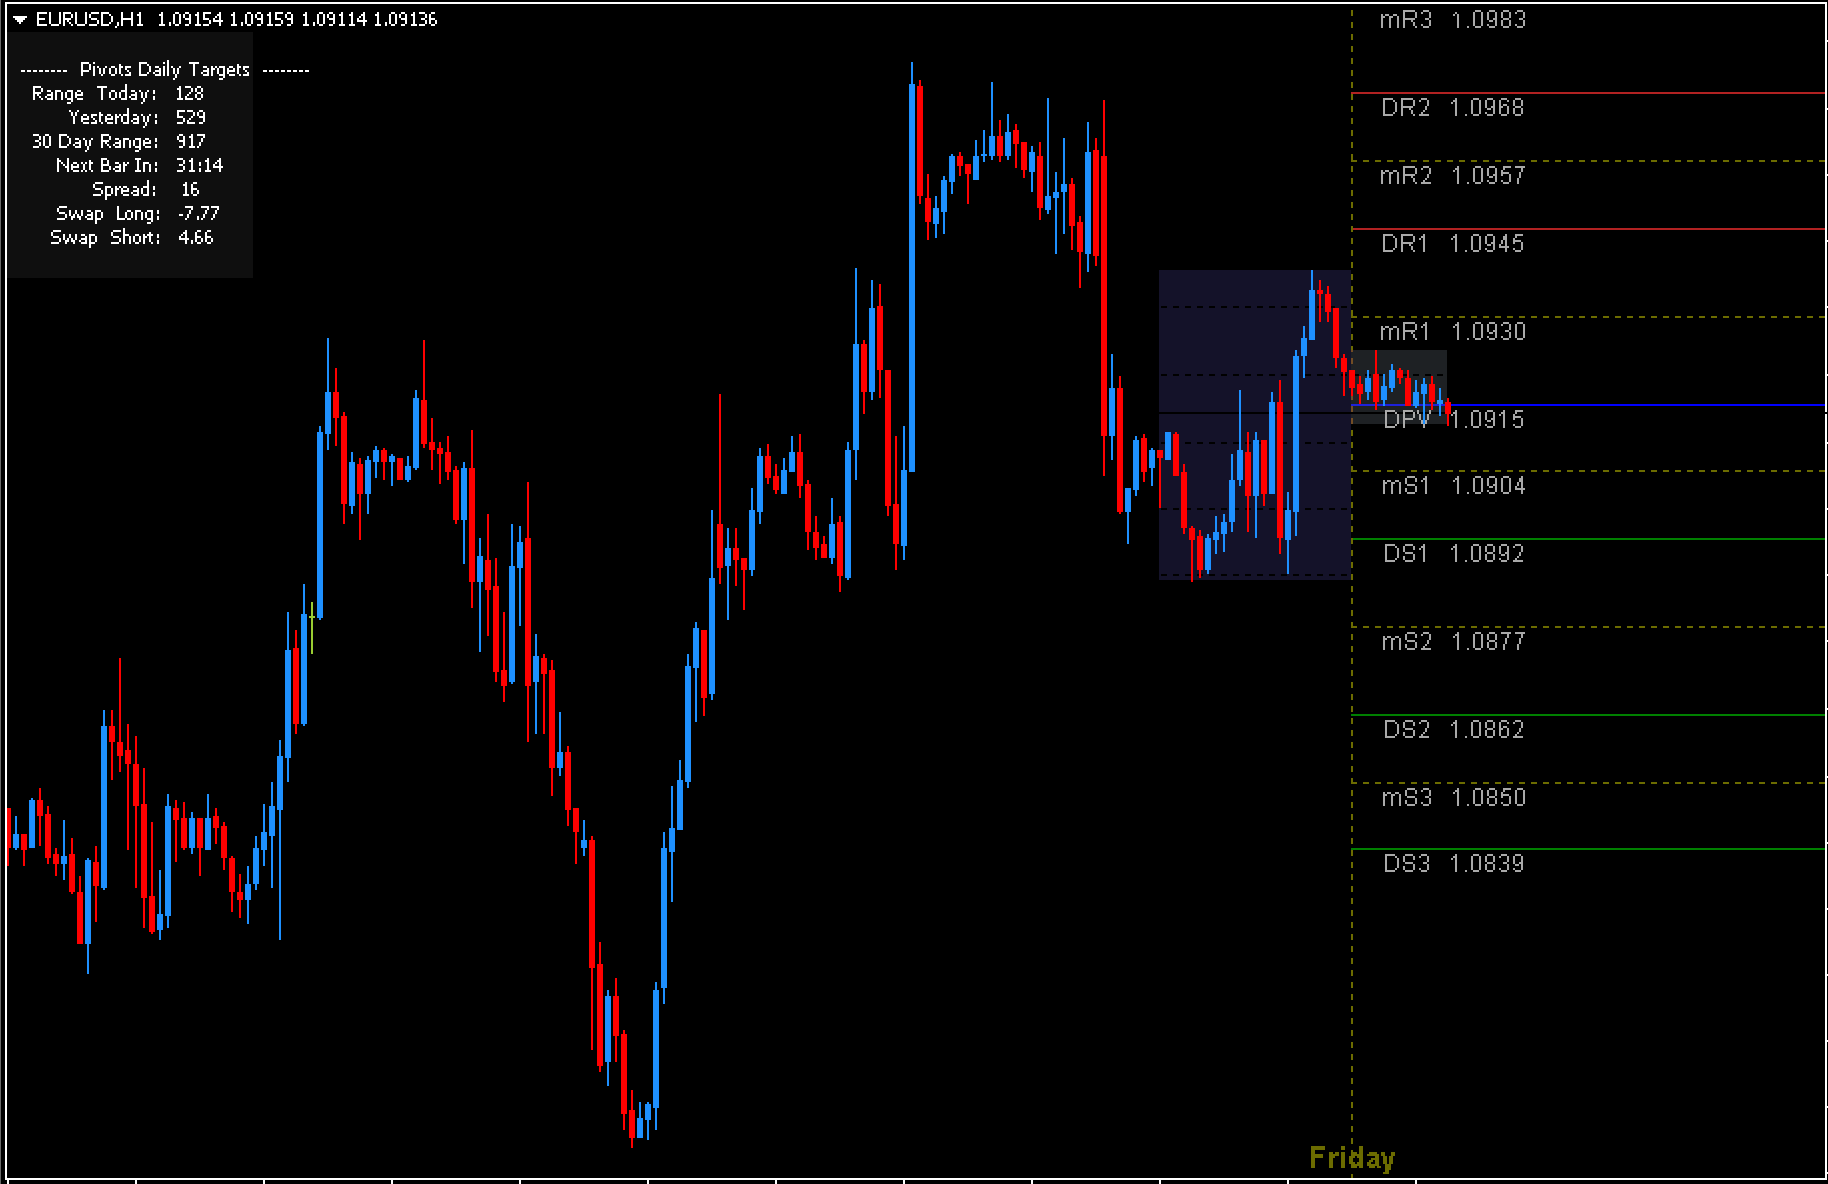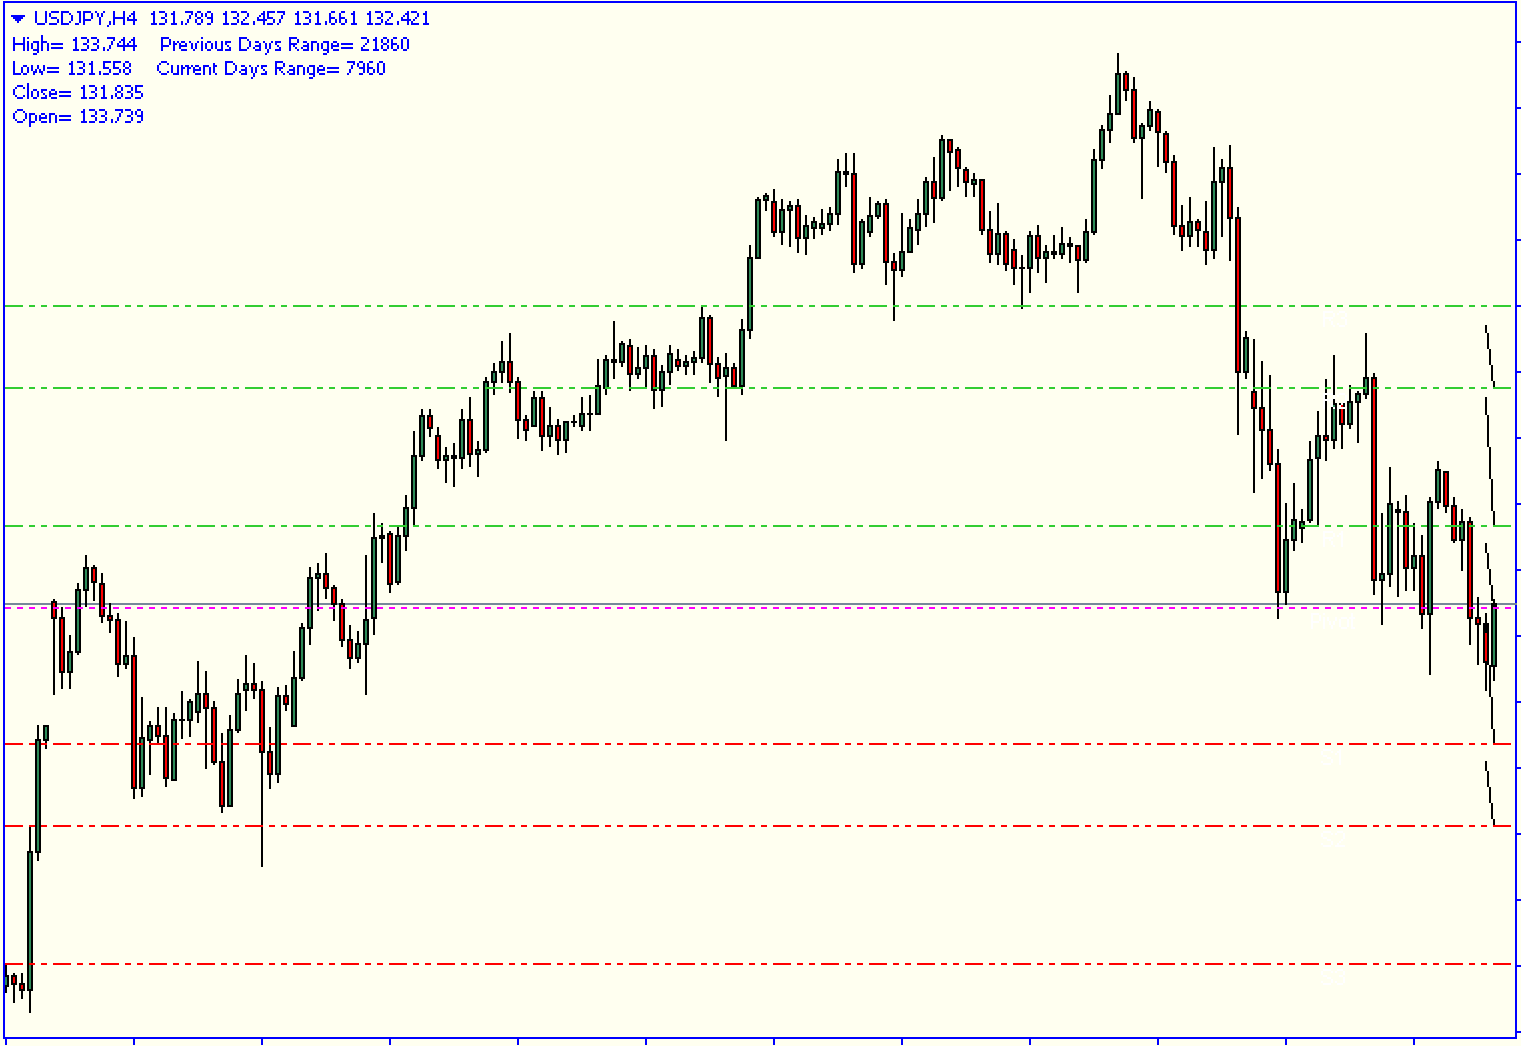
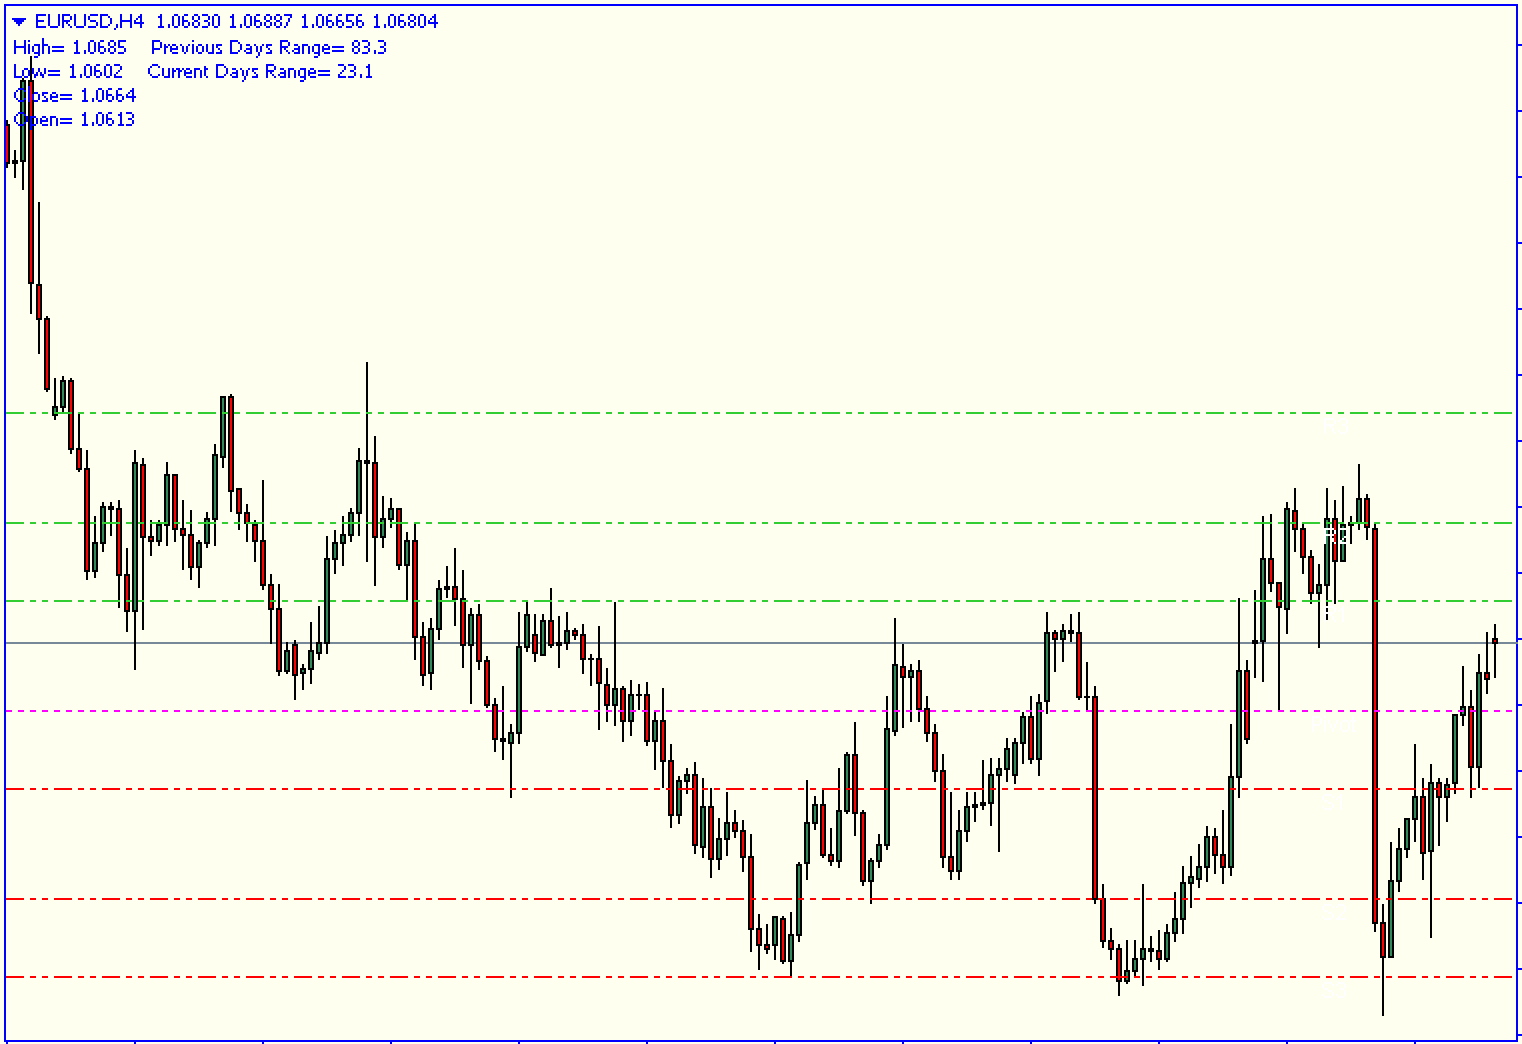
The Pivot Line Time Zone indicator is combined with another indicator to determine the top market trend. The details of the market trend are displayed on the indicator on the left side of your screen. It shows the current high and low of the market, as well as the previous and current day’s range, and the opening and closing prices.
The indicator draws pivot lines for a specific time frame and shows the high and low prices for that period. The indicator determines the daily price action range and draws the pivot lines accordingly. Together with the pivot lines, the indicator also draws the Camarilla points as well as the pivot points. In order to get an indication of the trend direction, traders should pay attention to the daily pivots.
Trading at the pivot level requires the trader to be familiar with the previous day’s pivot level. The indicator is best used for all time frames, but works better when applied to longer time frames. You can also download the Pivot Line Time Zone Indicator from our website.
Pivot Line Time Zone Indicator Buy/Sell Signals
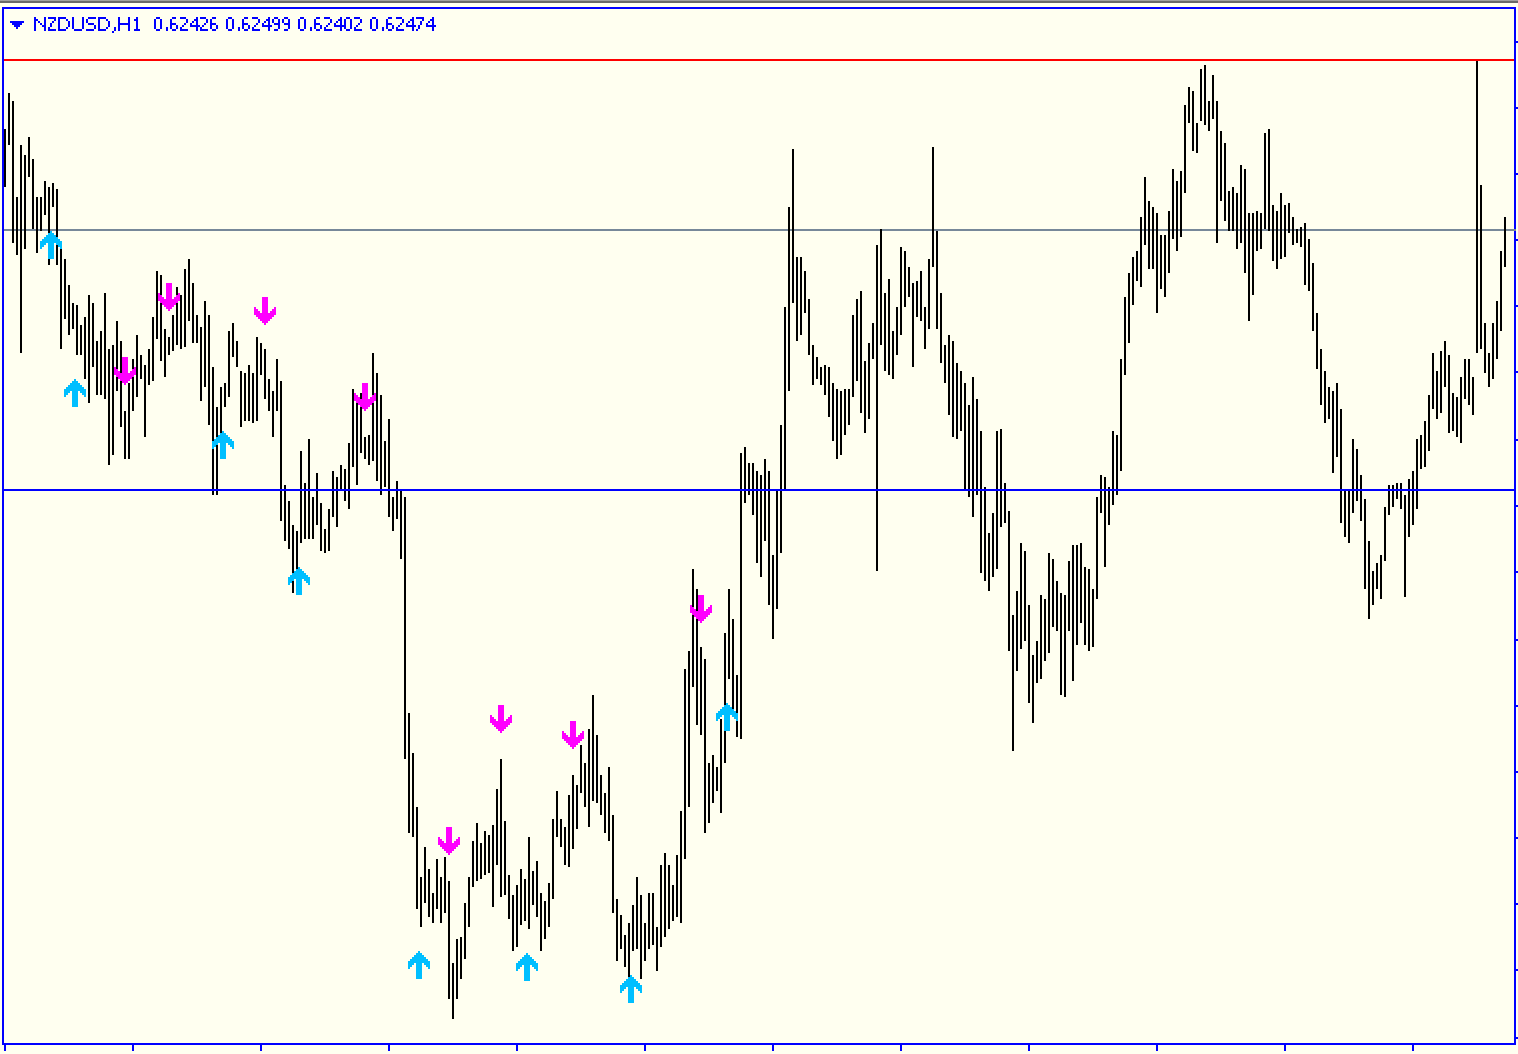
Trend indicator showing daily highs/lows, but not buy/sell signals. The indicator cannot show buy/sell signals unless it is combined with other indicators. Traders can use momentum oscillators such as RSI and MACD to determine buy or sell signals.
How do I use Pivot Lines?
The Pivot Line time zone indicator does not determine exact entry and exit points. However, pivot points are often used as support or resistance levels. These levels are indicators of stronger trends.
What is the most accurate pivot point indicator?
There are many types of pivot indicators. Each has its advantages and disadvantages. The Pivot Line Time Zone indicator eliminates the need to refer to traditional pivot line books. It also lists the high, low and closing prices.
Conclusion
The Pivot Line Time Zone Indicator can be used to identify the market trend of the day, as well as the trend of the past day. It helps to identify the highs and lows of the previous and current day, as well as the open and close prices. It does not provide a buy/sell signal by itself, but when combined with another indicator, it does provide a buy/sell signal.