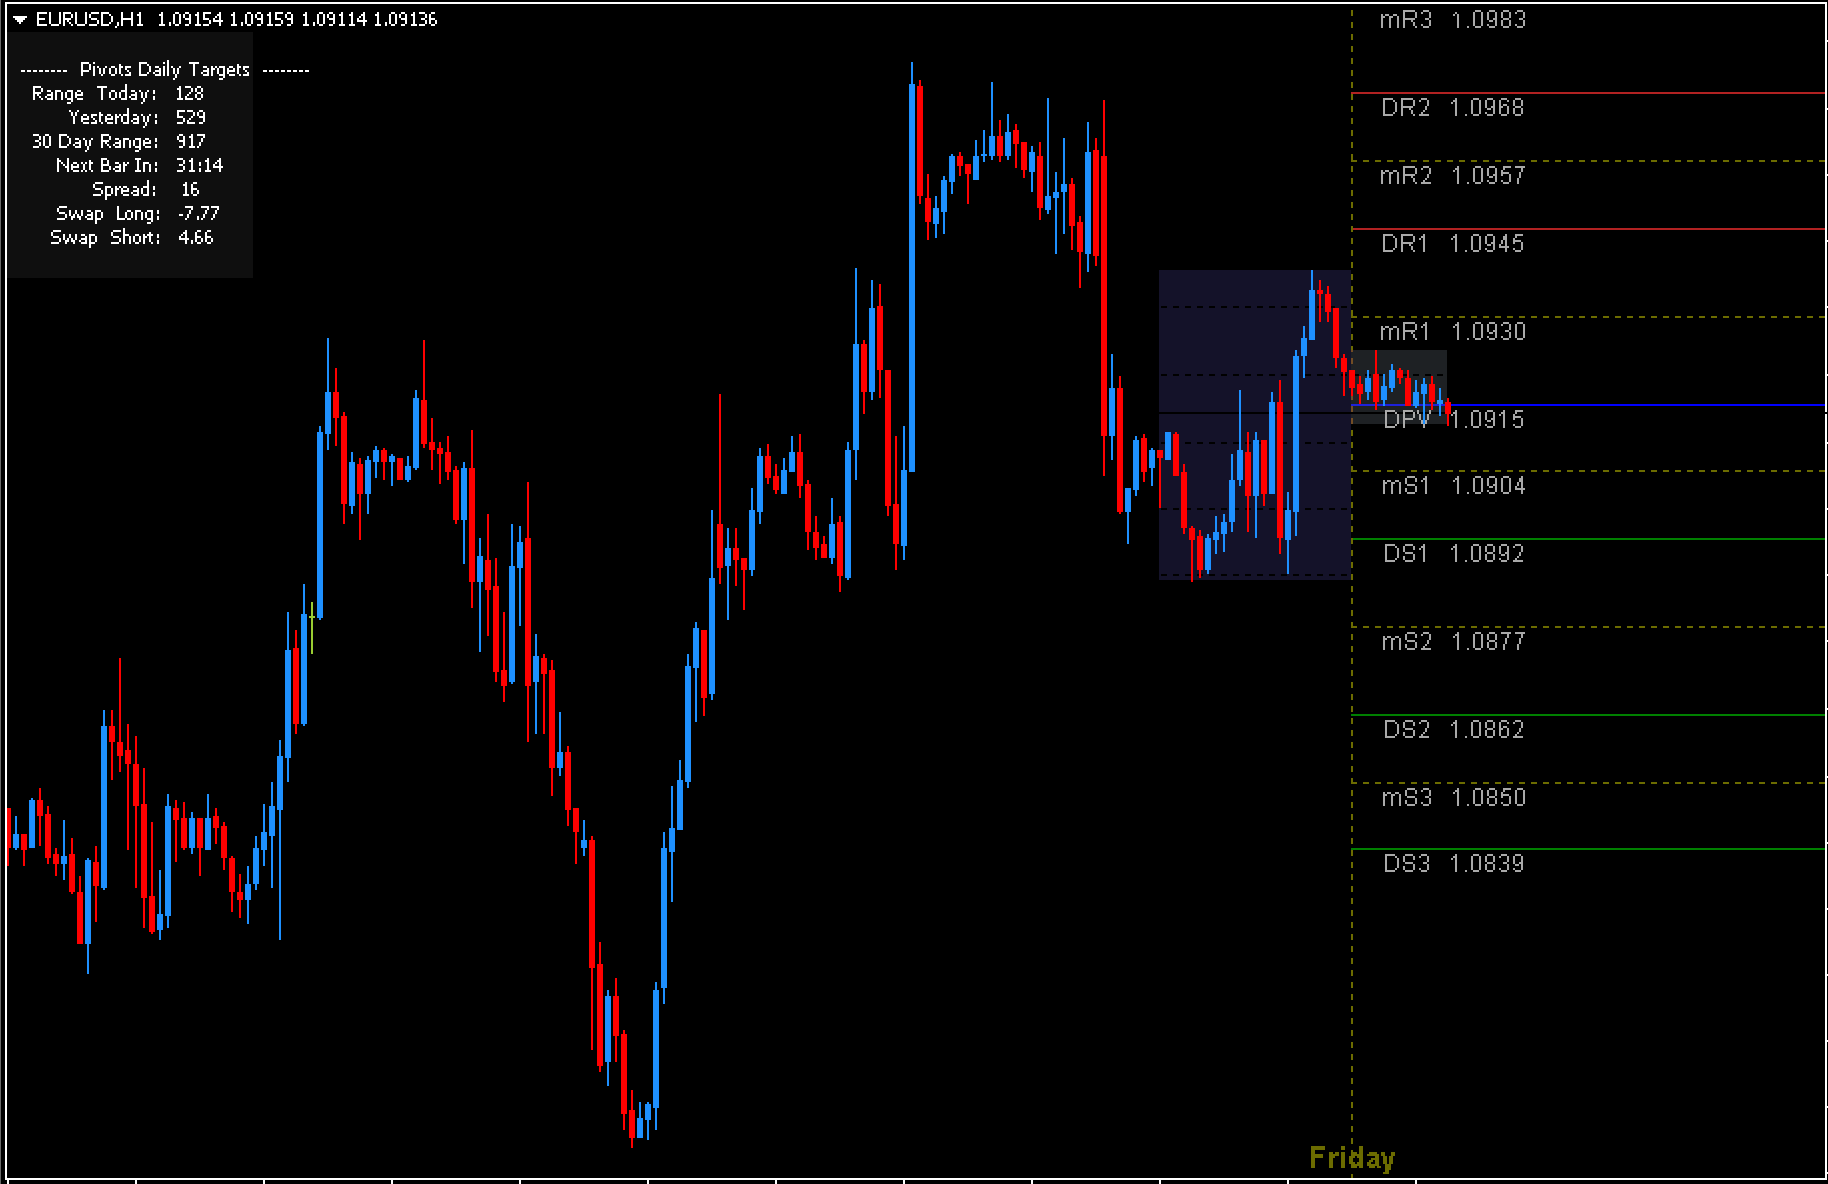
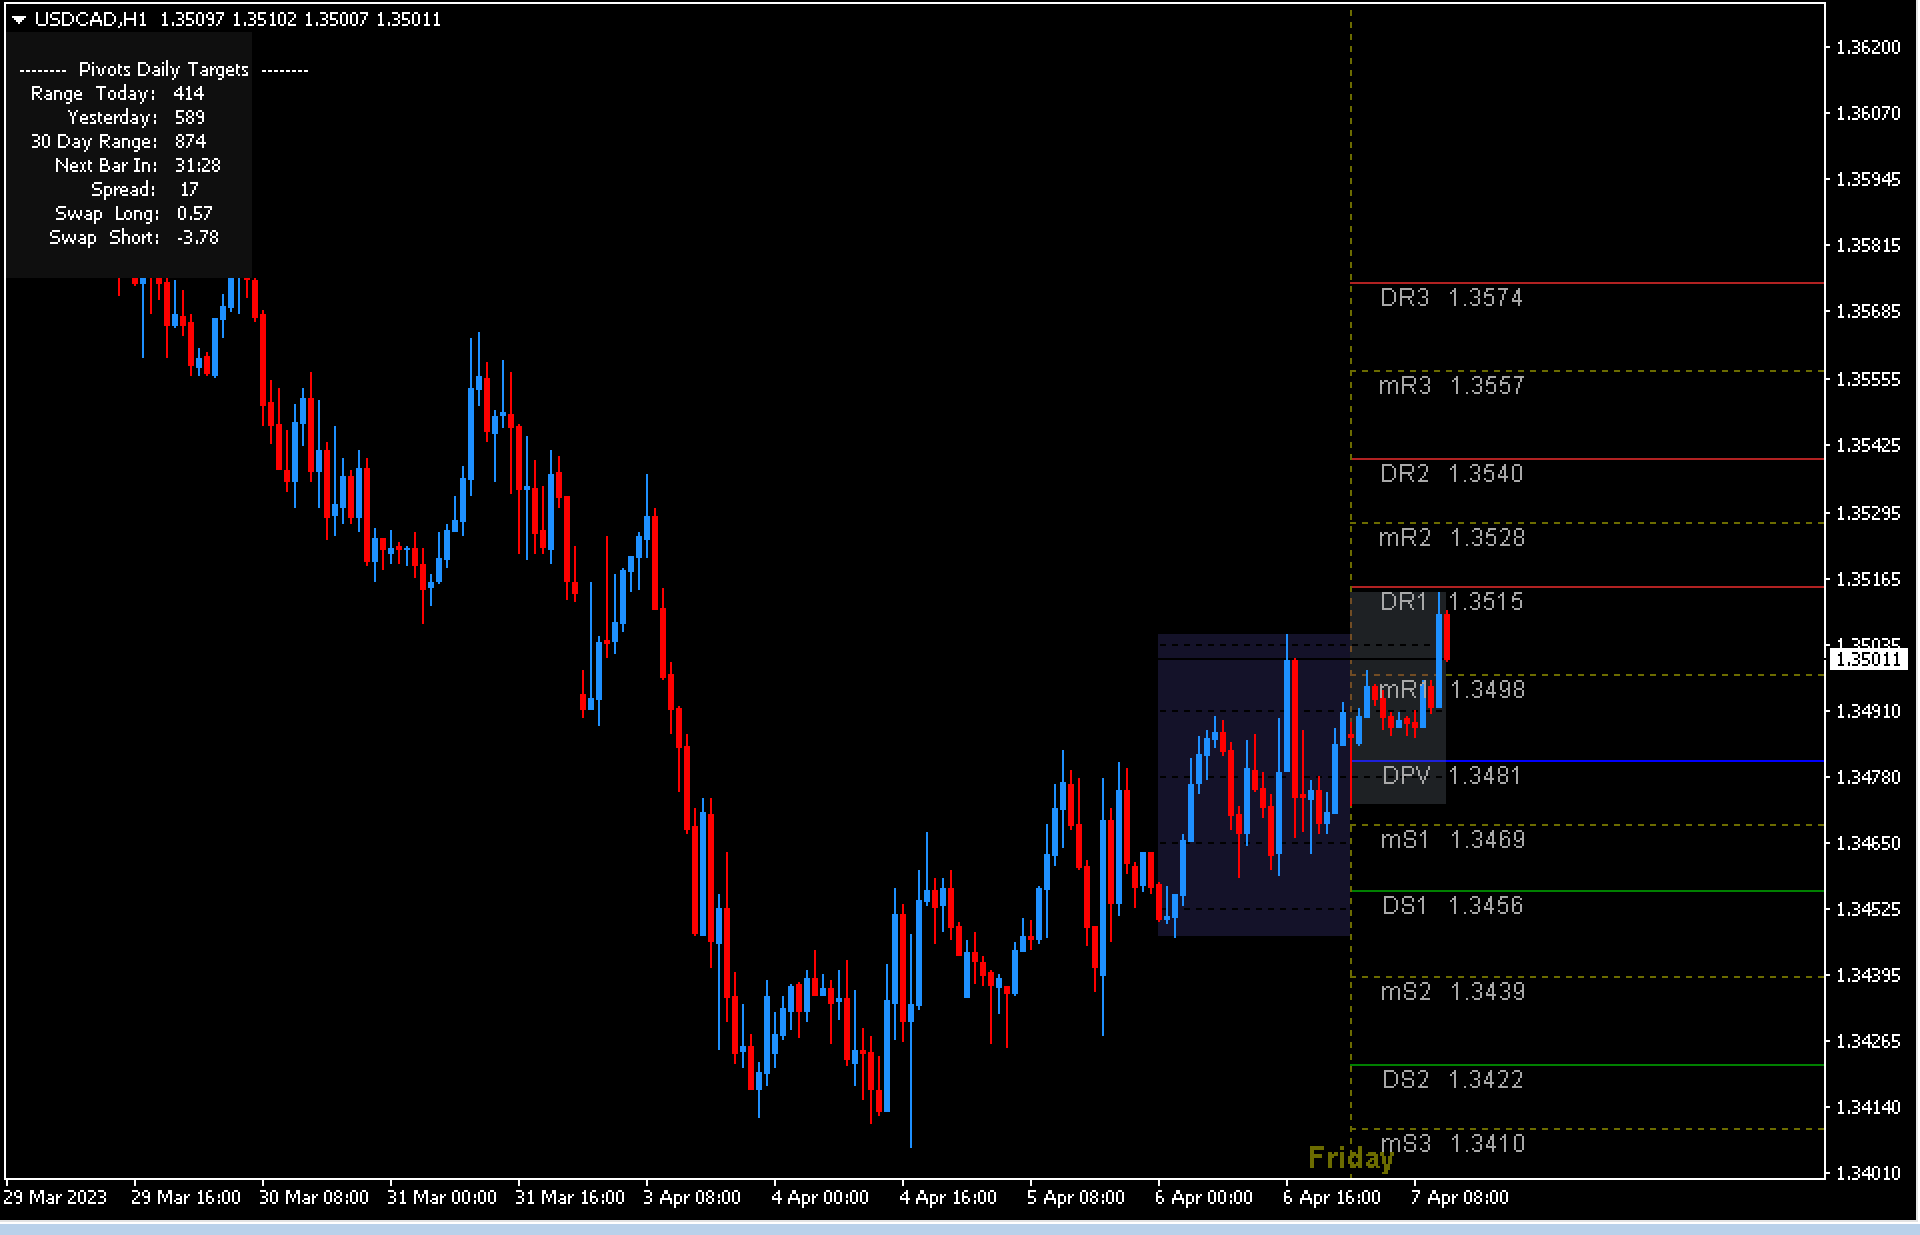
The daily pivot targets indicator (MT4) automatically calculates and displays daily pivot levels, along with three support levels and resistance levels. The indicator plots the midlines between successive support and resistance lines. It also displays the market for the current and previous days in a separate box, making it easy to identify. The following information is available to forex traders: This gives traders a comprehensive view of forex technical trading. It includes the daily range, the previous day’s range, the 30-day range, the time for the next bars, the spread of the charted instruments, and swaps for short and long. Forex traders can then identify bullish or bearish market conditions, and purchase and sell accordingly.
The indicator is effective for both novice and experienced forex traders. The indicator calculates daily open, high, close, and low values. However, the indicator also plots pivot lines and comments for all chart time frames. Forex traders can also download the indicator free of charge and easily install it.
Daily Pivot Targets For MT4 Trade Setup
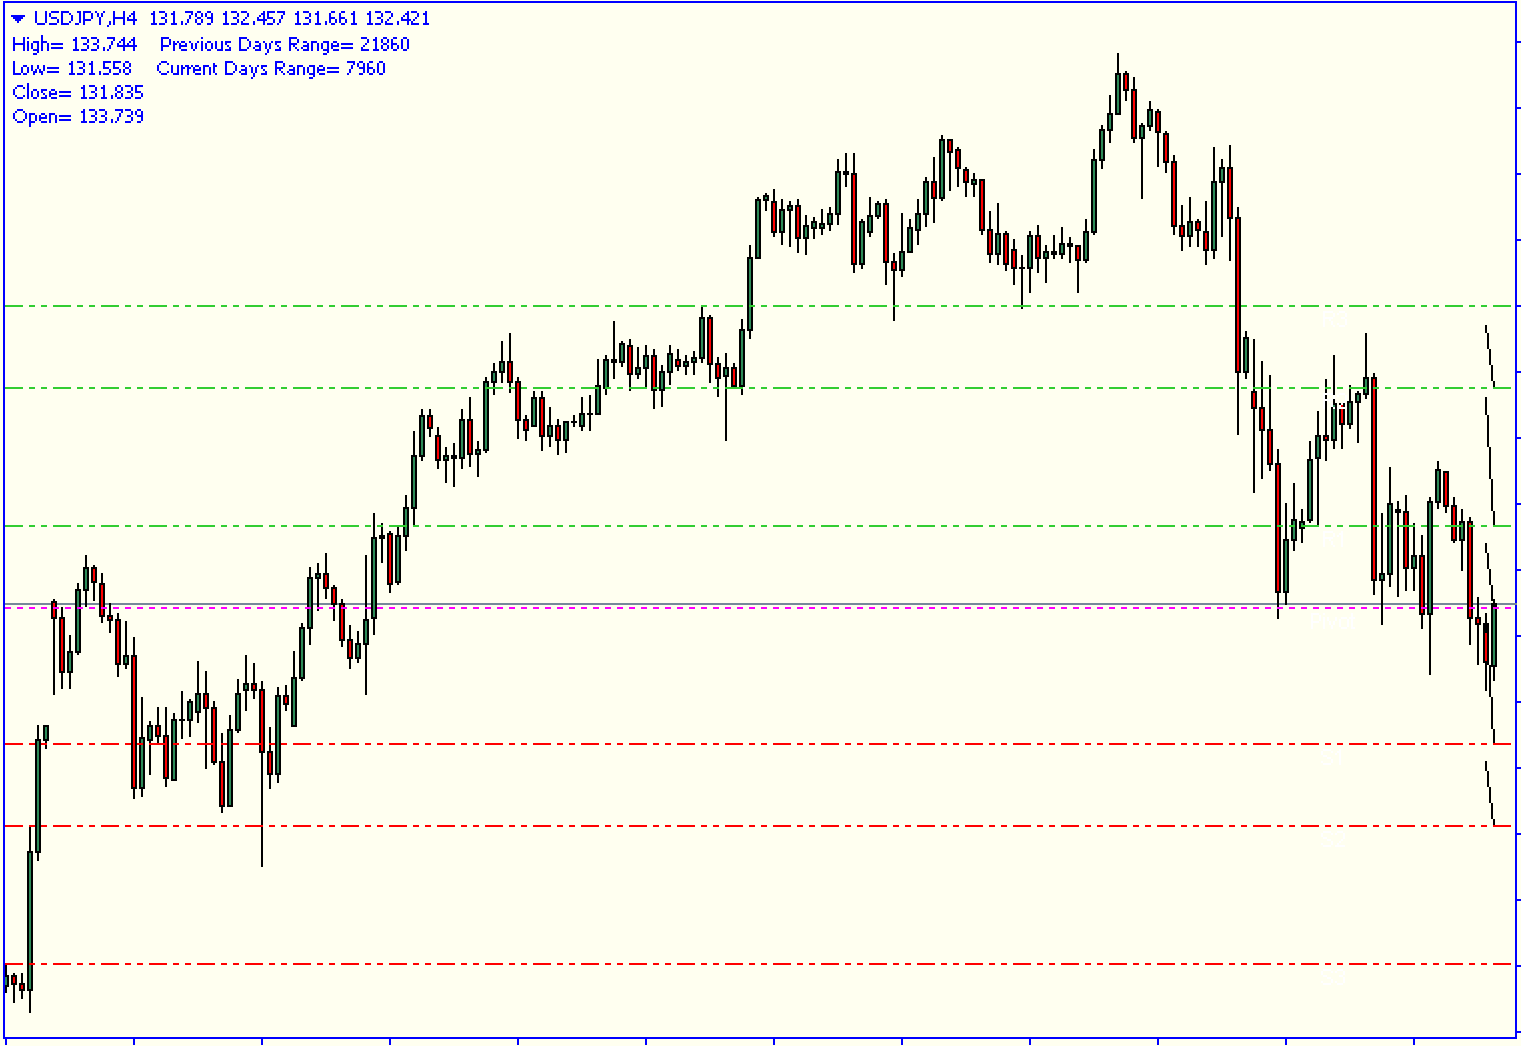
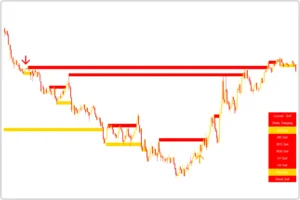
The indicator generally plots the pivot line (blue), the support lines (green) and the resistance lines (red). The indicator also places dotted lines as midlines between support and resistance.
Forex traders may buy if the price rises above the pivot level or breaks the first resistance level. This indicates a bullish market. Similarly. If the price falls below the pivot level or breaks below the first support, it is a sign that the market is bearish. Then traders should sell the trade and enter the market.
The support and resistance levels are good targets for profit booking or stop loss. Traders should calculate risk and reward according to the levels.
Conclusion
The daily pivot targets indicator for MT4 shows the pivot lines, support and resistance lines in a similar way to other indicators. The indicator shows the midlines between the support and resistance lines. Additional information can be found in the chart comment area.

