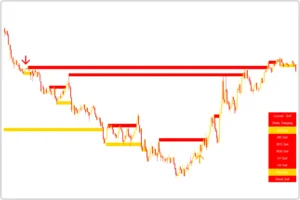
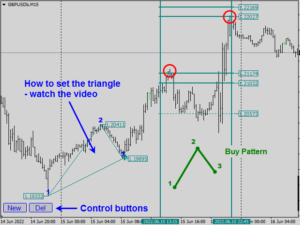
MetaTrader’s Trading Channel Indicator is the best forex trading tool for identifying support/resistance levels of an asset. The indicator was created to assist you in predicting potential changes in market trend bias at high price levels.
This technical trading indicator combines RVM Fractal Levels and Fibonacci Fans. Combining the Fibonacci Sector indicator with the fractal makes it a powerful tool for predicting trend reversal areas. It also allows you to determine the best trade entry/exit points.
The Trading Channels indicator can be considered a double-edged tool that identifies and trades trend reversals at key levels such as Fibonacci or Fractal lines.
The indicator automatically plots the trading channel. The indicator plots trading channels by identifying Fibonacci levels and Fibonacci retracement points on MT4 charts. It plots levels (fractals, Fibonacci) based on key market trends to ensure you do not trade against the market trend.
The Trading Channels indicator is also useful for intraday/day trading and swing trading. It is suitable for different types of traders. It is suitable for beginners, intermediate and advanced traders, etc.
Trade Channel Indicator
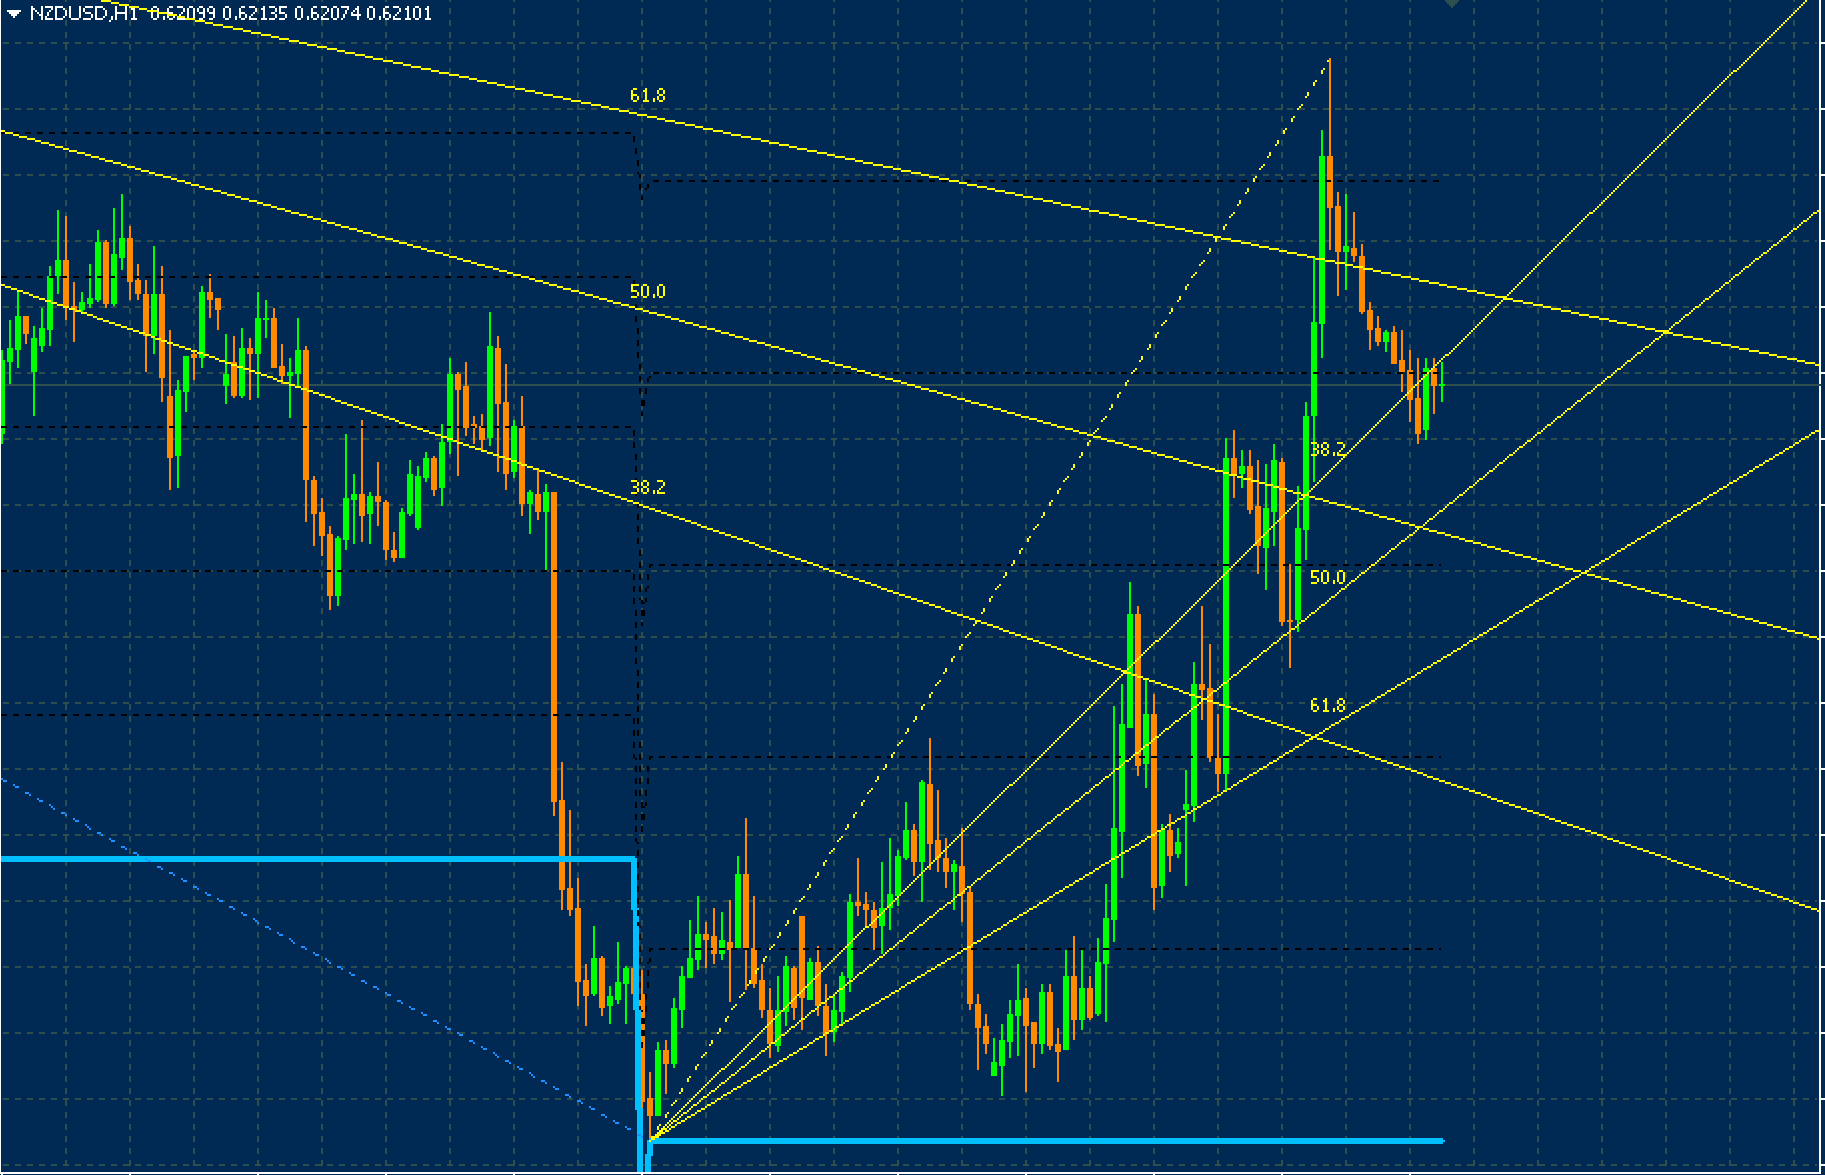
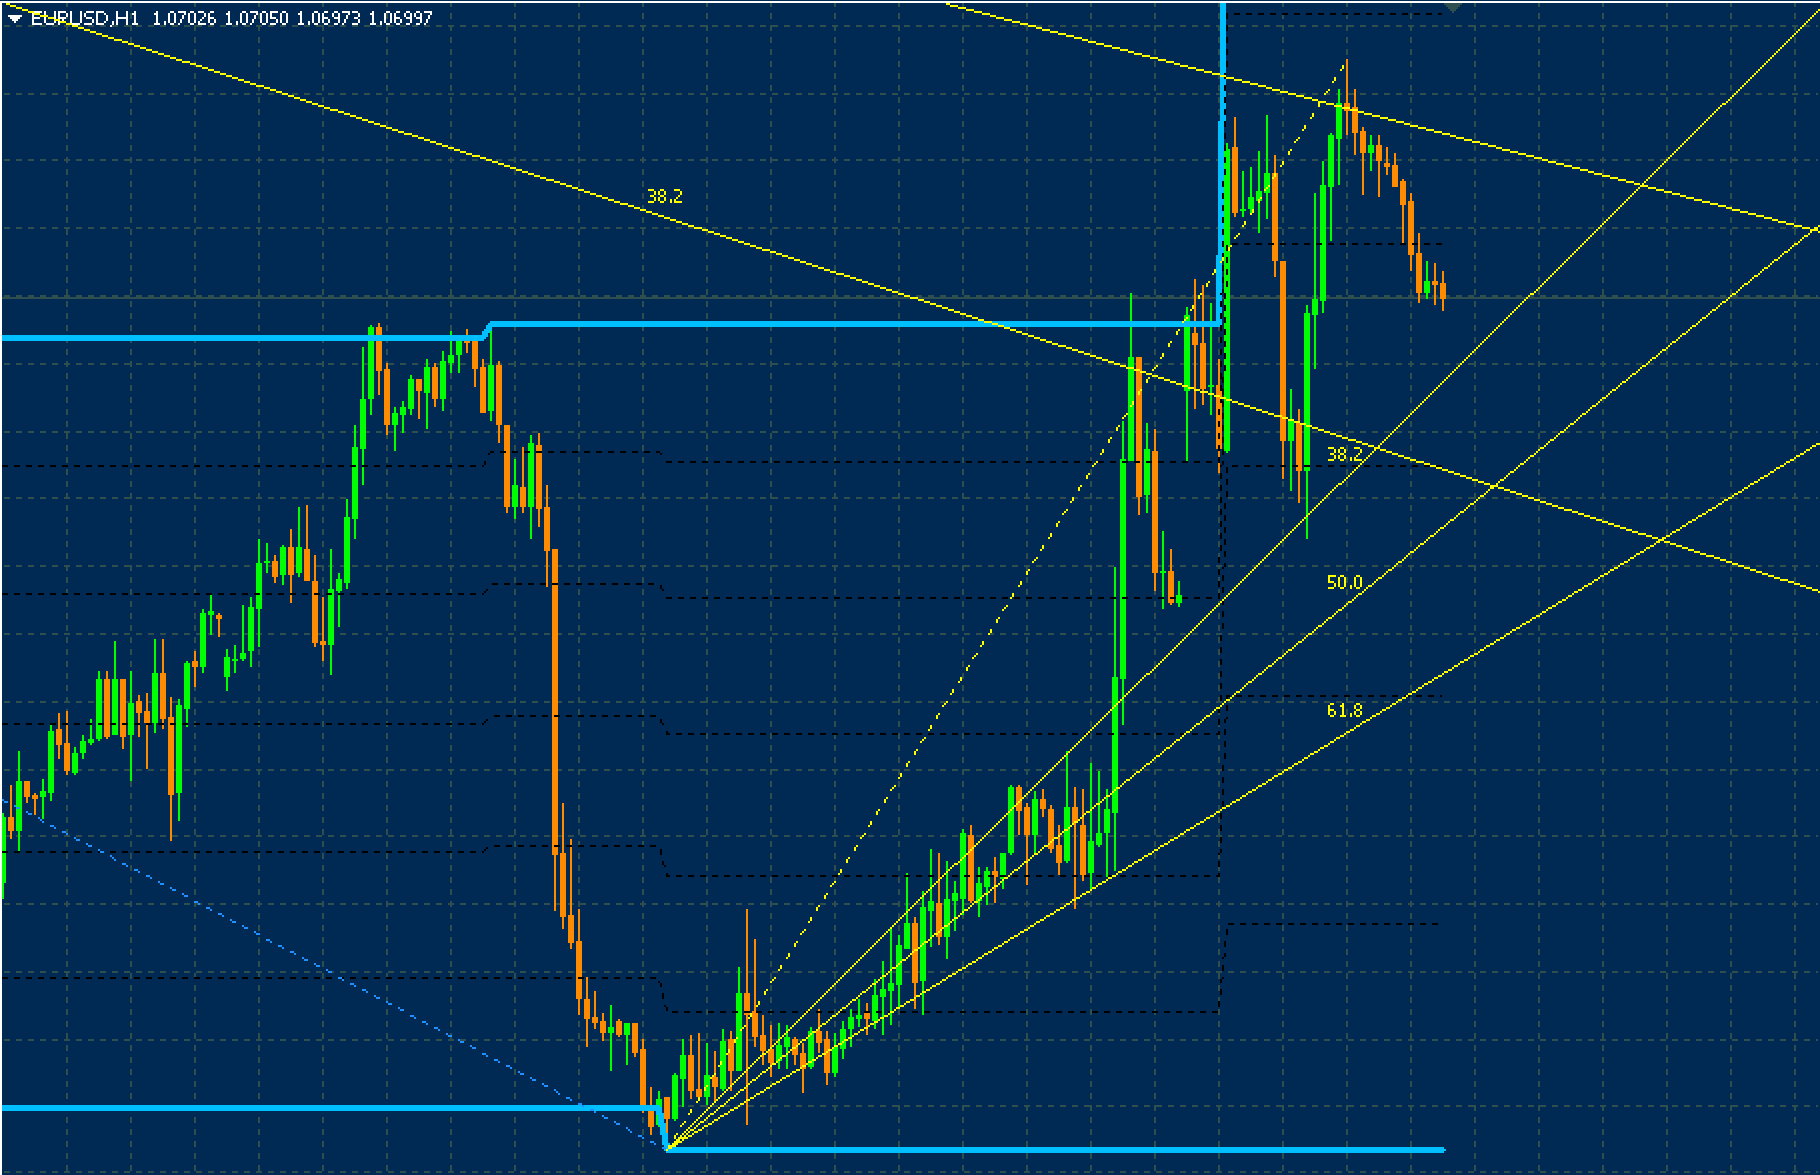
For efficiency, this indicator should be used in conjunction with price action/and other technical indicators. The thick blue line is the fractal level. The yellow line represents the Fibonacci retracement point and the corresponding value.
Buy or sell signals. Wait until the indicator draws fractal, Fibonacci levels, if trebd turns bullish. This condition allows you to open a buy/sell trade if the price retraces towards any level (fractal, Fibonacci). This principle also applies to sell signals.
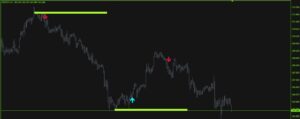
The screenshot shows the sell signal. This is a powerful setup that indicates a high probability of bearish trend reversal. The price meets at the fractal level, which coincides with the 50.0% Fibonacci level. This means that a trend reversal is possible due to the convergence of the double lines.
Summary
MT4’s Trade Channel indicator allows you to more accurately identify potential support/resistance areas. The indicator is not the Holy Grail. Therefore, it should not be used separately from price action (e.g. wick rejection, bullish/bearish engulfing, etc.) to achieve a higher win rate. This indicator is also available for download.

